

Qyrus Named a Leader in The Forrester Wave™: Autonomous Testing Platforms, Q4 2025 – Read More

Most software gets tested when organizations decide to change it. SAP Integrated Business Planning works the other way around: SAP changes it for you, four times a year, whether your team is ready or not. That one fact reshapes everything about SAP IBP testing, — who owns it, when it happens, and what breaks when it gets skipped. 

This guide approaches SAP IBP testing from a quality assurance angle: what makes IBP different from other SAP applications, the five layers every test strategy needs, how to plan around the quarterly release cycle, and the pitfalls that catch experienced teams. One clarification up front, if you searched this term looking for certification prep, this is not exam content. This guide is for teams responsible for keeping a live IBP environment stable. 

The stakes are real. IBP sits at the center of demand planning, supply planning, inventory optimization, and sales and operations planning (S&OP) for more than 1,000 companies worldwide. When a key figure  is calculated incorrectly or a data load silently corrupts planning data, planners make real decisions on wrong numbers. In a period when 94% of companies reported revenue damage from supply chain disruptions, the planning platform is the last place you want silent defects. 

Why SAP IBP Testing Is Different From Classic SAP Testing 

Teams arriving at IBP from ECC or S/4HANA testing often assume the same playbook applies. Four structural differences say otherwise. 

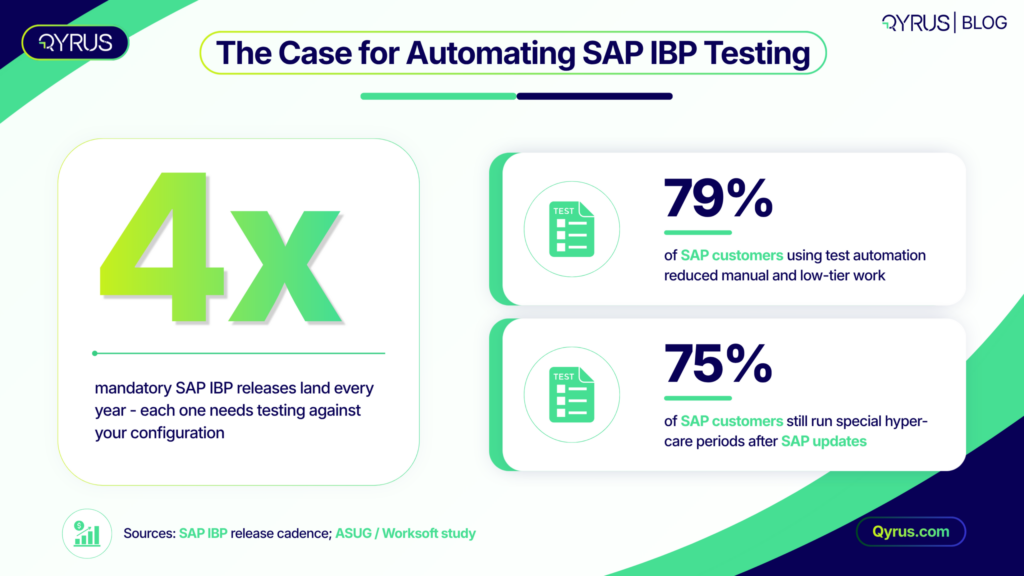
You do not control the release calendar. IBP is a cloud-only product, and quarterly updates add functionality but also require testing of the changed features once each update completes. There is no option to defer an upgrade for a year while you prepare. The release lands, and your configuration either still works or it does not. 

The platform keeps evolving underneath you. The 2508 release introduced I_SAPIBP2, a new unified planning area that combines time-series and order-based planning data, with initial solution content delivered in release 2511. Structural changes of this size can quietly invalidate assumptions baked into your planning views, custom key figures, and integration jobs. 

Your test environment options are thinner. Many SAP-provided IBP setups are two-tier — development and production — and a single test system limits your ability to verify bug fixes before they reach production, especially when several projects overlap on the same tenant. Some organizations now add a third tenant purely to separate testing from ongoing configuration work. 

The primary user interface lives in Excel. Planners spend most of their day in the SAP IBP add-in for Microsoft Excel. A new add-in version ships with every IBP release, and customers are responsible for rolling it out to individual users. Client-side version drift is a genuine test dimension that most web-application test strategies never consider. 

There is a fifth, quieter difference: planning logic in IBP is configuration, not code. Key figures, planning levels, attributes, and calculation chains are all configured. “Unit testing” in IBP means validating configured calculation logic against expected results, not reviewing custom ABAP. 
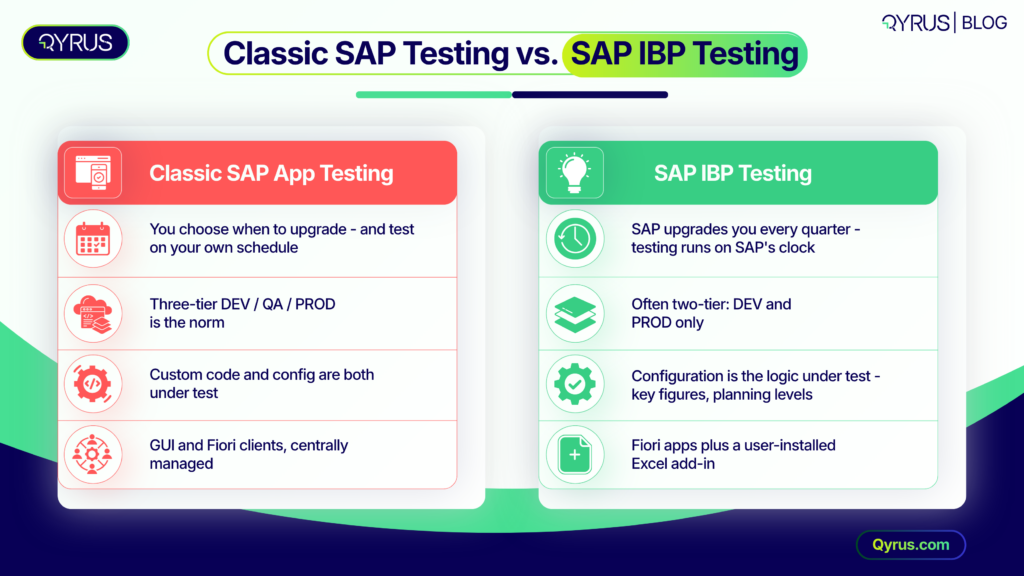
Classic SAP Testing vs. SAP IBP Testing

The Five Layers of SAP IBP Testing 

A workable IBP test strategy covers five distinct layers. Each one fails in a different way, so none of them can substitute for another. 
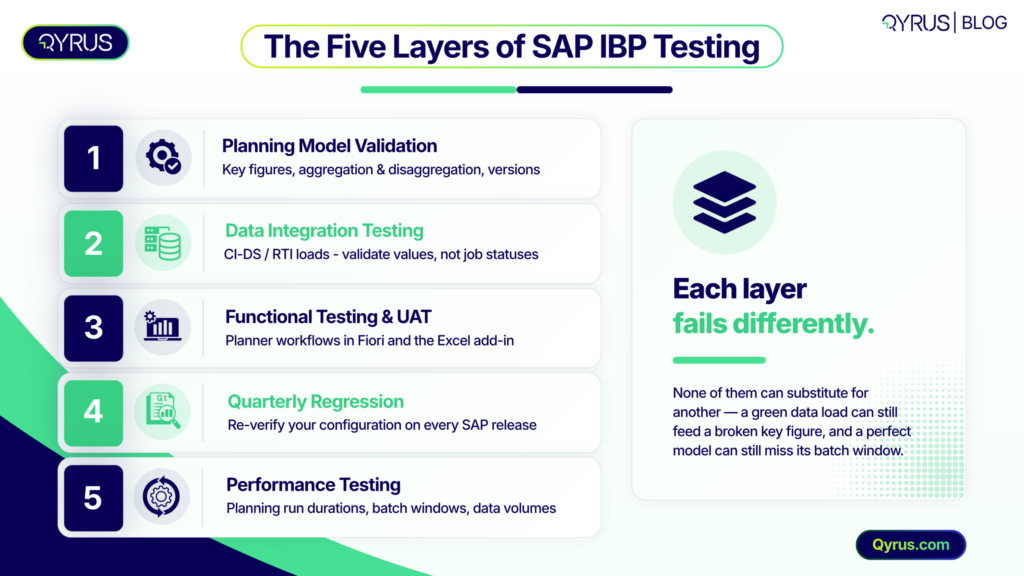
  1. Planning Model Validation

This is the IBP equivalent of unit testing. Verify that each key figure calculates correctly at its base planning level, that aggregation and disaggregation behave as designed across levels, and that planning versions and scenarios stay isolated from the baseline. The reliable method is a small, controlled dataset with expected outputs computed independently — in a spreadsheet, with calculations performed independently by a functional consultant and compared against what the model produces. If the numbers match at the lowest level and after aggregation, the model is sound. Pay particular attention to disaggregation rules, currency and unit-of-measure conversions, and time-profile boundaries such as week-to-month splits, because these are the places where a calculation can be right in one view and wrong in another. 

  1. Data Integration Testing

IBP receives master data and transactional data through Cloud Integration for Data Services (CI-DS), Real-Time Integration (RTI) for order-based planning, or SAP Cloud Integration.  The biggest trap is deceptively simple: a green job status means the load ran, not that the data is right. Experienced IBP practitioners push teams to confirm that data transformation worked correctly across all records within CI-DS, and to build target data integrity checks that catch issues before business users do. Reconcile record counts and key figure totals between source and target on every critical interface. This is the same class of problem as the “green light lie” in IDoc and EDI processing, which we covered in our guide to uncovering SAP IDoc/EDI mapping issues. 

  1. Functional Testing and UAT

Functional testing validates planner workflows end to end: running a statistical forecast, reviewing results in a planning view, adjusting a consensus demand figure, releasing a plan to supply. SAP’s own implementation guidance assigns unit and integration testing to the implementation team and puts user acceptance testing in the hands of business users — ideally the same planners who joined the design workshops. UAT should exercise both the Fiori apps and the Excel add-in, because planners will use both in production. For a deeper structure on running this phase well, see our guide to SAP user acceptance testing. 

  1. Regression Testing for Quarterly Releases

This layer is where IBP differs most from on-premise SAP. Every quarter, you need confidence that your existing configuration still works on the new release. SAP provides a Regression Test Service for SAP IBP that tests customer-specific configuration and reduces upgrade test effort, and it is worth evaluating — but its scope is defined by SAP, not by your risk profile. Custom planning views, integration chains, and any process spanning IBP and other systems remain your responsibility. Teams that automate this recurring core stop paying the same manual cost four times a year; our article on AI-driven SAP regression testing covers how that shift works in practice. 

  1. Performance Testing

 Planning runs, batch jobs, and data loads all operate within defined time windows, — a supply planning run that finishes at 6 a.m. instead of 2 a.m. breaks the planner’s morning. Track planning run durations and batch window fit release over release, and re-test whenever data volumes grow or the planning model changes materially. The discipline mirrors what we describe in our complete guide to SAP performance testing, applied to IBP’s job-centric workload. 
Building a Test Strategy Around the Quarterly Release Cycle 

Because the release cadence is fixed, the smartest move is to stop treating each upgrade as a project and start treating testing as a calendar-driven operating rhythm. 

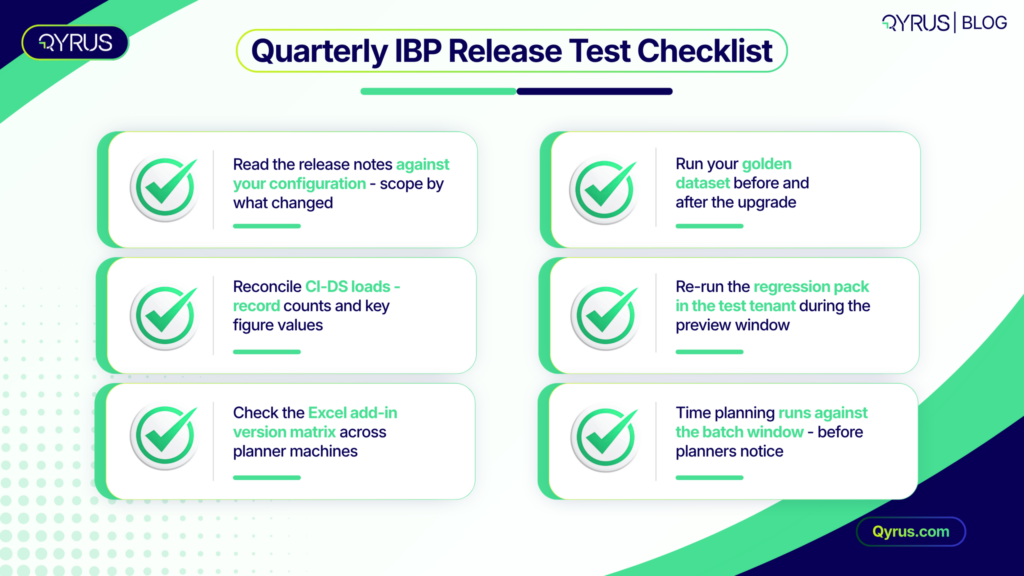
  • Anchor your test calendar to SAP’s release schedule. Test tenants receive each release before production. That preview window is your regression slot — plan for it in advance, every quarter, with named owners. 
  • Scope by risk, not by the pursuit of complete coverage 
  • Read the release notes against your own configuration and test what changed. Add what is critical — the steps of your S&OP cycle that feed real decisions — and what is complex, such as multi-level key figure chains and order-based planning integration. 
  • Maintain a golden dataset. Keep a stable, versioned set of master data and key figure inputs with known expected outputs. Run it before and after every upgrade. Without a baseline, you cannot tell a release defect from a data change. 
  • Decide your environment strategy deliberately. If you run on a two-tier setup, define how test data gets refreshed, who owns the test tenant during the preview window, and how you keep configuration-in-progress separate from upgrade validation. Organizations running several parallel IBP projects increasingly justify a third tenant for exactly this reason — it converts a scheduling conflict into a standing capability. 
  • Automate the recurring core. An ASUG and Worksoft study found that 79% of SAP customers using test automation reduced manual and low-tier work, while 75% of SAP customers still run special hyper-care periods after SAP updates. A quarterly cadence is exactly the pattern automation exists to absorb. 

Handled this way, the quarterly release stops being a fire drill. It becomes a known, bounded event with a fixed test scope and a predictable cost. 
Common SAP IBP Testing Pitfalls 

Trusting green statuses. Load jobs, planning runs, and application jobs all report technical success independently of business correctness. Validate outcomes, not statuses. 

Testing without a baseline. If master data drifts freely in your test tenant, every comparison becomes ambiguous. Snapshot your test data, version it, and refresh it deliberately. 

Validating only at aggregate level. A total that looks right can hide disaggregation errors underneath. Spot-check the base planning level, not just the summary view planners see first. 

Treating UAT as training. If business users first touch the system during UAT, you get a training session with a sign-off form. UAT verifies decisions made at design time; training belongs earlier and separately. 

Ignoring the Excel add-in matrix. Add-in versions, Office versions, and IBP releases interact. A planner on an old add-in can hit defects nobody reproduced in testing. Include the client version matrix in your regression scope, and factor it into tooling decisions when you choose an SAP testing platform. 

How Qyrus Helps With SAP IBP Testing 

Qyrus is an AI-powered, codeless testing platform with dedicated SAP testing capabilities, built for exactly the recurring-validation pattern that IBP’s quarterly cycle creates. 

  • UI5-aware test automation. IBP’s browser applications are built on SAP Fiori/UI5. Qyrus’s recorder detects Fiori/UI5 controls natively, avoiding the brittle XPath locators that make SAP UI automation expensive to maintain and staying resilient as SaaS interfaces change. 
  • The 3 Cs scoping framework. Qyrus structures SAP test strategy around what is Critical, Complex, and Changed — a direct fit for scoping each quarterly IBP release instead of re-testing everything. 
  • Self-healing scripts. When a UI update breaks a locator, Qyrus’ Healer references a passing baseline and suggests corrected locators, cutting the maintenance tax that normally kills SAP automation programs at cloud release speed. 
  • Codeless test building. Functional consultants and business analysts who understand planning processes can build and maintain tests without writing automation code, which keeps IBP process knowledge and test ownership in the same hands. 

The results pattern is established in SAP environments: a North American Coca-Cola bottler cut testing effort by 88% on a critical SAP process using Qyrus automation. Across the platform, a Forrester Total Economic Impact study of Qyrus found a 213% return on investment with a payback period under six months, driven in part by a 70% reduction in test building time. 

Frequently Asked Questions About SAP IBP Testing 

What is SAP IBP testing? 

SAP IBP testing is the validation of an SAP Integrated Business Planning environment across five layers: planning model logic, data integration, functional planner workflows, regression after quarterly releases, and performance of planning runs and batch jobs. 

How often does SAP IBP need regression testing? 

At minimum once per quarter, aligned to SAP’s release cycle. Test tenants receive each release ahead of production, and that window is the natural slot for the regression pass. Additional regression is needed after significant configuration or integration changes. 

Who should perform SAP IBP UAT? 

Business planners and process owners — ideally the people who participated in design workshops. The implementation or QA team handles unit and integration testing; UAT exists to confirm the system supports real planning work, which only business users can judge. 

Can SAP IBP testing be automated? 

Yes, and the quarterly cadence makes automation unusually valuable. Browser-based Fiori workflows and data validation checks are strong automation candidates. Manual effort is better reserved for exploratory testing and business judgment during UAT. 

What is the SAP Regression Test Service for IBP? 

An SAP-provided service that tests customer-specific IBP configuration to reduce the effort associated with quarterly upgrades. It is a useful component, but its scope is SAP-defined — custom views, integrations, and cross-system processes still need your own regression coverage. 

Turn the Quarterly Upgrade into a Non-Event 

SAP IBP rewards teams that treat testing as a standing capability rather than a scramble. Build your strategy around these five layers, anchor your calendar to the release cycle, keep a golden dataset, and automate the regression core you will otherwise repeat by hand four times a year. Do that, and the quarterly release becomes what it should be: routine. 

Qyrus brings codeless, self-healing SAP test automation to that rhythm, so planning teams keep their confidence without growing their testing headcount. Request a demo to see how Qyrus can help you keep every IBP release stable without the quarterly fire drill. 
Welcome to the July release!  

This month, our engineering teams focused on advancing our AI capabilities, streamlining enterprise collaboration, and fortifying foundational performance across every corner of the platform. 

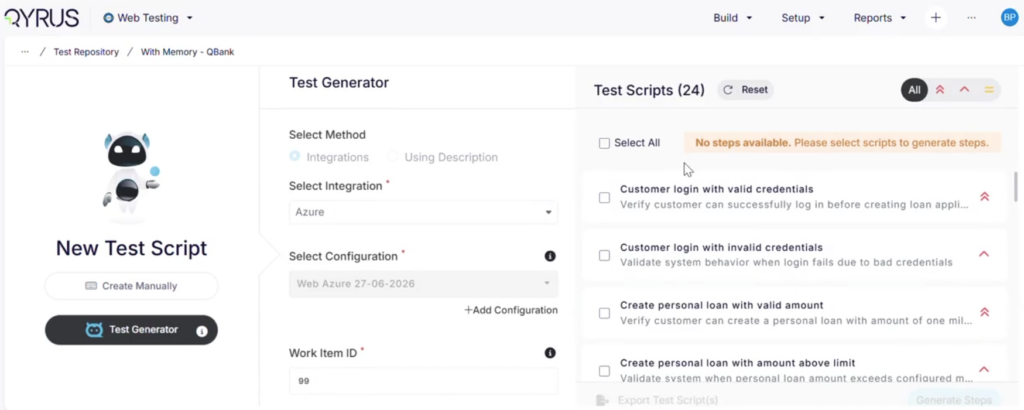
As testing pipelines scale and applications become more dynamic, efficiency and visibility are paramount. In Web Testing, we are putting you in complete control of your AI workflows with a new Two-Stage Test Generation pipeline that previews scenarios before building code—slashing latency and saving tokens. We’re also embedding continuous quality assurance directly into your suites with the new AI-powered LLM Evaluator Service, while solidifying modular architecture with permanent Function Step Reference Linking and centralized integration security. 

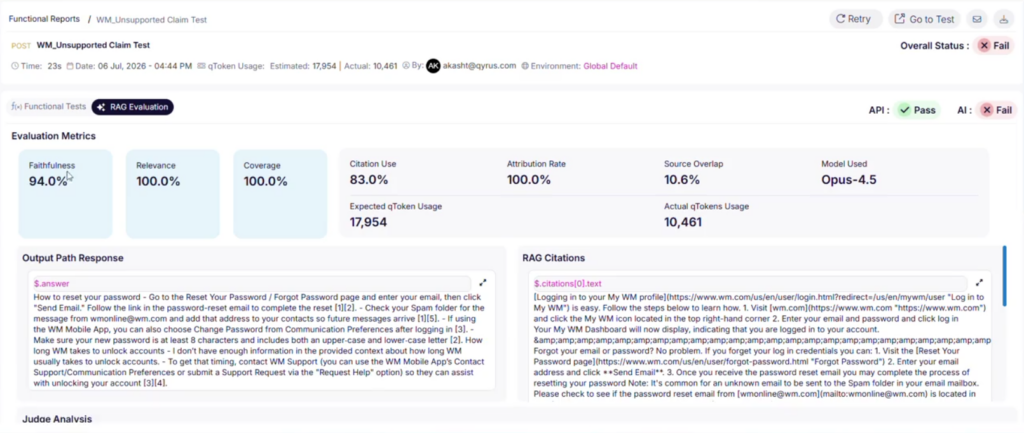
In API Testing, we are bridging the gap between quality engineering and generative AI by introducing a dedicated RAG Evaluation Test Type. This feature empowers you to validate LLM faithfulness, relevance, and citation precision natively alongside your standard REST suites. We have also overhauled large-scale workspace management with high-performance asynchronous cloning jobs to ensure smooth, uninterrupted UI performance. 

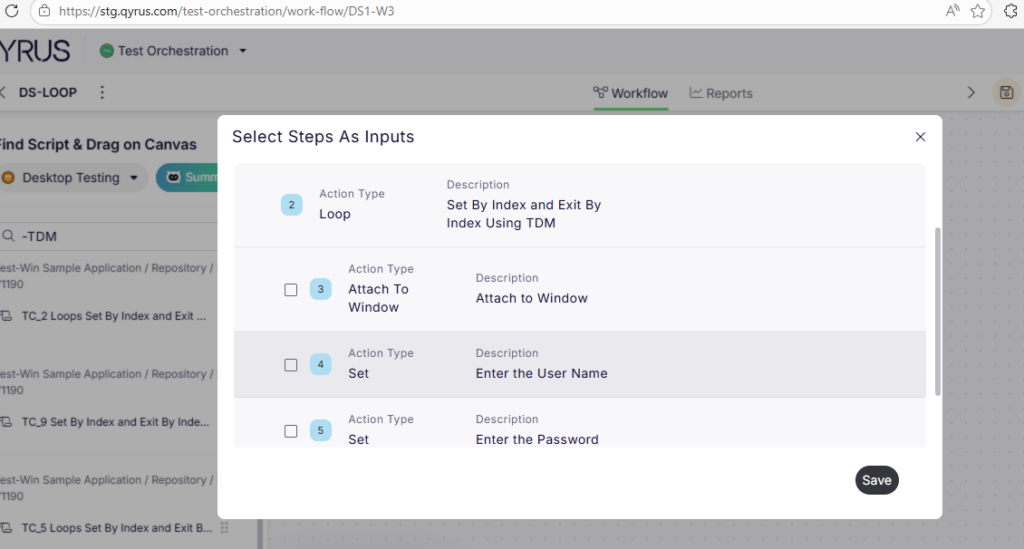
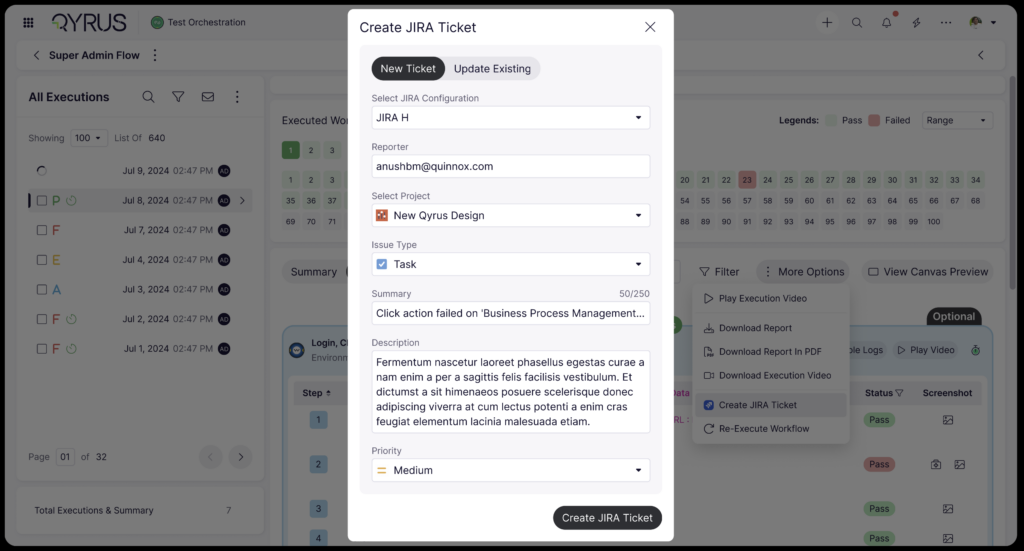
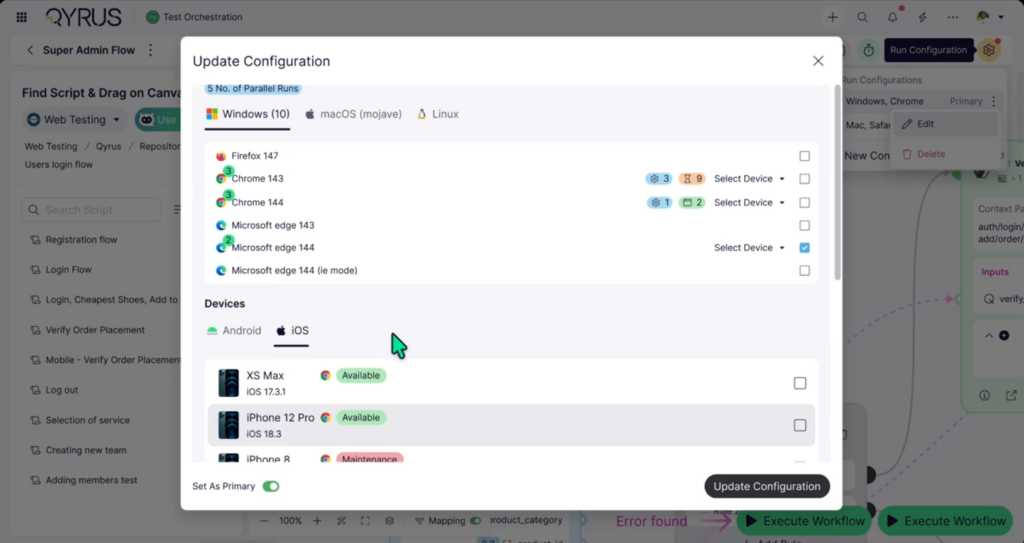
Our cross-platform execution engines have received major usability upgrades as well. Desktop Testing now automatically detects and flags parameterized scripts, while Test Orchestration gains comprehensive loop rendering for desktop workflows. Collaboration and resource management are smoother than ever: Device Farm introduces team-based hardware filtering and hardened AI session stability, and Test Orchestration brings you one-click Report Deep Linking, integrated Jira defect creation, and real-time device and browser availability indicators right in your run configurations. 

Let’s dive into the full breakdown of everything new across the platform this July!

Web Testing

Smart Optimization: Two-Stage Test Generation! 

Two-Stage Test Generation

The Challenge:  

Generating comprehensive web automation scripts using AI is incredibly powerful, but parsing full test steps, localizing elements, and compiling underlying logic requires high processing power and time. Previously, Test Generator v2 operated as a single, continuous pipeline. The engine would immediately build the full, granular steps for every single scenario it conceived. If the initial high-level testing path wasn’t exactly what you needed, tokens and execution time were wasted creating detailed code for a script you ultimately discarded. 

The Fix:  

We have re-architected Test Generator v2 into a high-efficiency, two-stage generation pipeline. In the first stage, the AI quickly drafts a high-level preview of the contextual test scenarios for your review. Once you scan the overview and select the specific paths you want, the engine moves to the second stage—utilizing historical context and deep memory only to build the detailed execution steps for your chosen scenarios. 

How will it help?  

This intelligent layout shift gives you total control over the AI engine, drastically cutting down on test creation overhead. 

  • Massive Cost & Token Savings: Stop burning AI tokens on long, multi-step scripts that don’t match your goals; only pay for the deep generation of scenarios you explicitly approve. 
  • Drastically Reduced Latency: Get high-level scenario previews on your screen in a fraction of the time, allowing you to iterate on test concepts almost instantly. 
  • Streamlined Control: Act as the ultimate editor—easily filter out redundant paths or incorrect approaches early in the lifecycle before a single line of automated test code is written. 

Built for Reuse: Function Step Reference Linking!

The Challenge:  

In large-scale web test automation, modular design is essential. Creating shared function steps—like standard login routines, navigation flows, or common form fields—saves hours of duplicative effort. However, maintaining the integrity of these shared steps across multiple test scripts was previously a fragile process. If a shared component’s references broke during script updates, it severely impacted traceability and made managing large modular test repositories incredibly difficult to audit. 

The Fix:  

We have introduced Function Step Reference Linking within the Web Testing framework. Shared function steps now establish and actively maintain a strict, permanent reference linkage across all consuming test scripts. This ensures that no matter how complex your test architecture becomes, the parent-child connection between the shared component and the individual scripts remains perfectly locked in place. 

How will it help?  

This underlying infrastructure update maximizes the efficiency and reliability of modular testing. 

  • Flawless Component Reusability: Confidently update a central function step once, knowing its reference linkages are firmly intact across every single test script that relies on it. 
  • End-to-End Traceability: Easily audit your automated test suites by instantly tracking exactly which scripts reference a specific shared function step, streamlining compliance and impact analysis. 
  • Sturdier Automation Architecture: Eliminate broken dependencies and fragile maintenance loops caused by disconnected script components, keeping your web testing suites clean, lean, and highly maintainable. 

Centralized Security: Seamless Integration Consent Migration!

The Challenge:  

Connecting your web testing workflows to external tools should be simple and secure. Previously, managing user permissions and access consents for third-party integrations was tied directly to the core user profile page rather than the underlying integration gateway. This disconnected setup created friction when onboarding new platforms and occasionally led to authentication delays as requests bounced between unrelated backend services. 

The Fix:  

We have officially migrated user-level integration consent management entirely into our dedicated Integration Service. By onboarding updated APIs to the WSO2 API Gateway and executing a comprehensive SQL database migration to seamlessly preserve all historical user consent records, the platform now handles authentication permissions natively within the integration layer itself. 

How will it help?  

This architectural migration streamlines your security setups and tool connectivity. 

  • Frictionless Tool Setup: Enjoy a faster, more intuitive experience when linking external applications, with all consent prompts managed dynamically by the integration layer. 
  • Zero Downtime Access: The successful backend data migration ensures your existing tool authorizations remain active and completely uninterrupted. 
  • Unified API Infrastructure: Centralizing authentication logic within the dedicated Integration Service lays the groundwork for faster, more secure connections to future third-party integrations. 

Intelligent Quality Assurance: The LLM Evaluator Service!

The Challenge:  

Reviewing test execution logs, identifying root causes of flaky tests, and grading the overall quality of automated test scripts are critical but time-consuming tasks. Testing teams often spend hours digging through post-execution data to understand why a test failed or how to optimize a script for better coverage. Without localized intelligence, catching subtle script design flaws before they reach production remains a major bottleneck. 

The Fix:  

We are thrilled to introduce the LLM Evaluator Service—a brand-new, AI-powered intelligence layer built directly into the Web Testing framework. This service continuously analyzes your test scripts and execution results, serving as an automated quality auditor that evaluates script health, detects structural inefficiencies, and provides instant, context-aware feedback on failures. 

How will it help?  

This cognitive service transforms raw test results into clear, actionable optimization strategies. 

  • Automated Failure Analysis: Receive instant, plain-language summaries explaining why a test failed, separating actual application bugs from environmental or locator-based issues. 
  • Script Quality Grading: The AI reviews the structure of your automation scripts, flagging redundant steps, suboptimal waiting strategies, or fragile assertions to ensure your code follows best practices. 
  • Proactive Optimization Feedback: Get automated recommendations on how to harden your test suites against flakiness, helping your team build highly resilient test cases with minimal manual code reviews. 

Smarter Metadata: Auto-Detection of Parameterized Scripts!

The Challenge: Parameterizing test scripts—replacing static inputs with dynamic variables—is crucial for scaling data-driven desktop testing. However, as test libraries grow across multiple enterprise projects, keeping track of which scripts are parameterized and which are static used to require manual labeling or exhaustive script audits. If a team missed updating a script’s parameterization status, it led to inaccurate project dashboards and data configuration errors during batch executions. 

The Fix: We have introduced Auto-Detection of Parameterized Scripts within the Desktop Testing framework. The platform’s analysis engine now actively scans your automation workflows in real time. The moment a script is configured with parameterized steps or dynamic variables, the system automatically flags it with the correct parameterization indicator across your entire project workspace. 

How will it help? This automation enhancement eliminates manual tagging errors and provides absolute clarity across your testing suites. 

  • Flawless Indicator Accuracy: Rely on perfectly synchronized project indicators that update automatically, completely removing the risk of manual tagging oversights. 
  • Streamlined Data-Driven Testing: Instantly identify which desktop automation scripts are ready for variable data injection directly from your high-level project view. 
  • Effortless Library Auditing: Gain immediate visibility into the configuration state of your testing assets, making large-scale test suite management and refactoring incredibly straightforward. 

Next-Gen AI Validation: RAG Evaluation Test Type!

RAG Evaluation Test Type

The Challenge: As enterprises increasingly build and deploy Retrieval-Augmented Generation (RAG) applications, validating these AI-powered endpoints using traditional API assertions (like exact string matching or static schema checks) falls short. Determining whether an LLM’s response is accurate, relevant to the prompt, and faithfully grounded in the retrieved documents without hallucinating previously required teams to build complex, standalone evaluation frameworks disconnected from their core API testing suites. 

The Fix: We have introduced a dedicated RAG Evaluation test type directly within the API Testing framework under the Test Cases section. To keep configuration minimal and simple, we’ve designed a straightforward configuration form where you can map the core elements of your RAG payload using an intuitive JSONPath or XML Path picker (complete with immediate preview support). You can map out your QuestionAnswerRetrieved Context arrays (including field mappings for doc_idtext, and score), and optional Citations. Behind the scenes, the evaluation runs asynchronously in the background, utilizing an AI judge to score the output against custom pass/fail/review metric thresholds across three vital dimensions: faithfulnessrelevance, and citation precision. 

How will it help? This specialized test capability bridges the gap between traditional software quality assurance and cutting-edge AI validation. 

  • Simple but Powerful Mapping: Seamlessly extract and bind complex, nested API response payloads directly to your evaluation model without messy scripting, thanks to advanced JSONPath and XML Path pickers. 
  • Instant, Deep Metrics: Instantly access an AI judge’s explicit analysis, reasoning, and threshold rankings directly from both the Preview Responses tab and the final Execution Report panels. 
  • Background Execution Efficiency: Keep your testing workflows moving fast; the platform handles the intensive computational evaluation asynchronously in the background, ensuring zero bottlenecks in your API execution pipeline. 

High-Performance Workspace Management: Async Clone & Copy Jobs!

The Challenge: As your API testing suites grow to encompass hundreds of endpoints, complex schemas, and dense script libraries, duplicating these assets can become incredibly resource-intensive. Previously, cloning or copying large test suites and scenarios was processed synchronously. This meant the platform attempted to complete the entire data migration while locking your interface, frequently resulting in annoying UI freezes, browser loading delays, or network timeouts when attempting to duplicate massive enterprise workspaces. 

The Fix: We have upgraded our backend architecture by transitioning all suite and scenario duplication tasks to run asynchronously through a dedicated, high-performance job queue. Now, when you initiate a clone or copy operation—no matter how large the suite—the platform instantly queues the task and processes the data transfer seamlessly in the background. 

How will it help? This backend optimization guarantees smooth, reliable performance even during your heaviest workspace migrations. 

  • Zero Browser Timeouts: Confidently duplicate massive, enterprise-scale test suites without worrying about network bottlenecks, loading loops, or dropped connections ruining the transfer. 
  • Uninterrupted Workflow: Never stare at a frozen loading screen again; initiate large-scale cloning operations and immediately continue writing, editing, or executing tests while the platform handles the heavy lifting behind the scenes. 
  • Rock-Solid Reliability: The dedicated job queue ensures that every single API script, dependency, and configuration parameter is transferred cleanly and accurately, completely eliminating the risk of partial or incomplete copies. 

Targeted Hardware Allocation: Team-Based Device Filtering!

The Challenge: 

Managing a centralized enterprise Device Farm with dozens or hundreds of connected mobile devices can quickly become overwhelming. Previously, device-related APIs lacked explicit team-level metadata. This made it difficult for engineers and automation pipelines to cleanly filter out hardware reserved for other departments, forcing testers to manually sift through massive, un-grouped device inventories just to find the specific mobile hardware allocated to their active project. 

The Fix: 

We have enhanced our core Device Farm infrastructure by integrating explicit team name attributes directly into all device-related APIs. You can now easily filter, organize, and view your available physical and virtual devices based specifically on team assignments, ensuring a much cleaner experience across both the platform UI and your programmatic integrations. 

How will it help?

This metadata upgrade brings instant organization and clearer boundaries to shared hardware environments. 

  • Clutter-Free Device Selection: Instantly isolate and view only the hardware assigned to your specific team, bypassing irrelevant enterprise inventory and finding your test target in seconds. 
  • Smarter CI/CD Automation: Leverage the updated APIs to dynamically configure your continuous integration pipelines, guaranteeing that automated test suites programmatically target and reserve only the devices dedicated to your team. 
  • Reduced Resource Conflicts: Prevent accidental bookings and scheduling overlaps across departments by establishing clear, transparent hardware visibility for every team in your organization. 

Seamless AI Execution: Enhanced Device Farm AI Sessions!

The Challenge: 

Running intelligent, AI-powered test sessions on real mobile devices requires high-speed, reliable communication across multiple backend microservices. Previously, managing authentication headers and routing high-volume traffic through API gateways during dynamic AI sessions could occasionally lead to network bottlenecks or dropped connections. Additionally, when an AI session finished, gathering all the resulting test assets—such as device logs, screenshots, and AI decision traces—was a disjointed process, as these artifacts were often scattered across isolated services. 

The Fix: 

We have significantly upgraded the backend architecture for AI-powered Device Farm sessions. This update introduces optimized header handling for cleaner request routing, deeper API gateway integration for superior network performance, and robust cross-service artifact management that automatically organizes and links your test outputs. 

How will it help? 

This structural enhancement ensures a significantly smoother, faster, and more unified AI testing experience on mobile devices. 

  • Rock-Solid Session Stability: Enhanced header handling and streamlined gateway routing eliminate communication bottlenecks, guaranteeing stable, uninterrupted connectivity between the driving AI engine and your test devices. 
  • Unified Artifact Tracking: Stop hunting through disconnected services for test data; all execution logs, video recordings, screenshots, and AI diagnostic traces are now cleanly consolidated and immediately accessible from a single location. 
  • Accelerated Debugging: With cleaner network routing and centralized asset management, diagnosing and resolving complex, AI-driven mobile test failures becomes significantly faster and more intuitive. 

Effortless Sharing: Report Deep Linking!

 The Challenge: When a complex orchestration suite finishes executing, pointing a colleague or stakeholder to a specific failure or run analysis can be frustrating. Previously, sharing an execution report meant telling team members to manually navigate through the Test Orchestration hierarchy, select the correct project, filter by schedule or workflow, and hunt down the exact timestamped log. This manual navigation added unnecessary friction to time-sensitive debugging sessions and slowed down cross-team communication. 

The Fix: We have implemented Report Deep Linking across Test Orchestration. Every execution report now automatically generates a unique, shareable URL powered by a dedicated deep link ID and updated UI routing. You can now copy and share direct links with your colleagues, complete with built-in access validation that ensures the report loads seamlessly for authorized team members while keeping unauthorized access locked out. 

How will it help? This workflow upgrade eliminates navigation friction and accelerates your collaborative debugging. 

  • One-Click Debugging: Drop direct URLs to specific execution reports into Slack, Teams, or Jira tickets, getting your engineers looking at the exact same failure logs and metrics instantly. 
  • Secure Team Access: Built-in access validation guarantees that shared links open smoothly for authorized teammates while rigorously maintaining your enterprise security boundaries. 
  • Eliminate Navigation Overhead: Bypass repetitive menu clicking, search queries, and manual filtering entirely; jump straight from a chat notification directly into deep report analysis. 

Comprehensive Iteration Tracking: Desktop Loop Support!

Desktop Loop Support

The Challenge: 

When running data-driven or repetitive desktop automation scripts that utilize loop structures within a unified Test Orchestration (TO) workflow, visibility into the individual iterations was previously limited. While the core loop might execute smoothly on the target machine, the orchestration reporting engine struggled to cleanly break down and display each individual cycle. This resulted in generic or cluttered execution logs where child steps and iteration numbers were either lumped together or obscured, making it frustrating to pinpoint exactly which data pass failed during a complex desktop test run. 

The Fix: 

We have introduced full native support for Desktop Testing loops across Test Orchestration workflows and execution reports. The orchestration engine now accurately parses loop structures, providing explicit iteration numbering and clear, hierarchical rendering of child steps for every individual cycle directly inside your execution reports. 

How will it help? 

This reporting upgrade brings absolute clarity and granular traceability to your data-driven desktop automation suites. 

  • Granular Loop Visibility: Track repetitive desktop workflows cycle by cycle with explicit iteration numbering, eliminating guesswork when reviewing multi-pass execution logs. 
  • Hierarchical Child Step Rendering: Enjoy clean, organized reporting layouts where child steps within loops are properly nested and displayed, making complex script logic easy to follow at a glance. 
  • Pinpoint Failure Resolution: Instantly isolate exactly which iteration or specific data set caused a desktop test step to fail without having to manually decipher raw, un-grouped execution data. 

Direct Defect Tracking: Jira Tickets from Execution Reports!

The Challenge: When an automated workflow fails during a Test Orchestration run, logging that defect into Jira used to be a disconnected, manual chore. Engineers had to switch tabs, manually copy error logs, timestamps, and execution metrics, and paste them into a brand-new Jira issue. This constant context-switching slowed down defect triage, increased the risk of leaving out critical debugging details, and created an unnecessary administrative gap between your execution results and your bug-tracking pipelines. 

The Fix: We have brought seamless Jira Integration directly into Test Orchestration execution reports, mirroring our popular Web Testing functionality. Once configured at the project level, you can now generate Jira tickets with a single click directly from your TO execution logs. Furthermore, we have upgraded the interface to support on-the-fly configuration—meaning if a project doesn’t have a Jira connection set up yet, the UI will intuitively guide you through creating the configuration right then and there without losing your place in the report. 

How will it help? This integration bridges the gap between test execution and project management, dramatically speeding up your development feedback loops. 

  • One-Click Defect Logging: Instantly convert failed test steps into structured Jira tickets directly from your execution reports, completely eliminating tedious copy-pasting and manual data entry. 
  • Rich, Contextual Bug Reports: Automatically arm your developers with the exact execution details, team metadata, and failure context they need to investigate, reproduce, and resolve issues faster. 
  • On-the-Fly Setup: Never get blocked by missing integrations; seamlessly establish new project-level Jira connections right from your reporting dashboard with a refreshed, user-friendly setup flow. 

Proactive Scheduling: Device & Browser Availability in Run Config!

Device and Browser Availability in Run Config

The Challenge: 

Setting up an automated test run only to have it sit indefinitely in a pending queue—or fail to launch entirely—because the target hardware is occupied is a common source of friction. Previously, Test Orchestration’s Run Configuration lacked real-time visibility into your infrastructure’s availability. Testers had to assign execution environments blindly, frequently resulting in scheduling conflicts, resource bottlenecks, and delayed feedback cycles when multiple test pipelines attempted to target the same busy mobile device or browser instance simultaneously. 

The Fix: 

We have integrated live Device & Browser Availability status indicators directly into the Test Orchestration Run Configuration interface. Now, when setting up your execution schedules, the platform dynamically checks and displays real-time operational statuses—such as free, busy, or offline—for every device and browser environment right as you configure your run parameters. 

How will it help? 

This instant visibility removes guesswork from your scheduling workflow and helps your team consume testing infrastructure much more efficiently. 

  • Eliminate Blind Scheduling: Confidently select open, ready-to-use test environments before triggering an execution, preventing your workflows from getting stuck in pending queues or failing due to offline hardware. 
  • Optimize Resource Utilization: Easily identify which physical devices and browser configurations are currently available, allowing you to dynamically reroute tests to open assets and maximize throughput across your infrastructure. 
  • Faster Execution Feedback: By proactively avoiding resource bottlenecks during the setup phase, your automated test runs kick off immediately and deliver actionable results back to your team without unnecessary delays. 

Ready to Leverage July‘s Innovations? 

We are committed to providing a unified platform that not only adapts to your evolving needs but also streamlines your critical processes, empowering you to release high-quality software with greater speed and confidence. 

Eager to explore how these advancements can transform your testing efforts? The best way to appreciate the Qyrus difference is to experience these new capabilities directly. 

Ready to dive deeper or get started? 

Book a Personalized Demo

The problem is not building tests. It is keeping them alive.  Here’s a scenario I’ve seen repeatedly. 

A conversation that is happening right now on my Slack 

“Half the tests in the overnight run have failed”. 
 
“Is the feature broken?” 

“No — dev updated the button ID on the login screen. Now every test that passes through login is broken.” 

“How long to fix?” 

“Probably a day. Maybe two if there are other changes we haven’t found yet.” 
 
Typing….. 

This is not a staffing problem, nor is it a process problem. It is a structural problem with how test automation works — and it has been getting worse every year as delivery cycles shorten, UI updates accelerate, and test suites grow larger. 

The question teams are searching for answers to is not ‘how do we write better tests.’  It is, “Why do our tests keep breaking when nothing is actually wrong with the application, and what do we do about it?” 

The Qyrus guide covers that question specifically: what causes test maintenance to consume the majority of QA engineering time, why the problem compounds as suites scale, and how AI-powered self-healing can potentially change the economics of automation maintenance. 

 The Test Maintenance Problem Has Gotten Worse Since 2023 

est Maintenance Problem Has Gotten Worse Since 2023

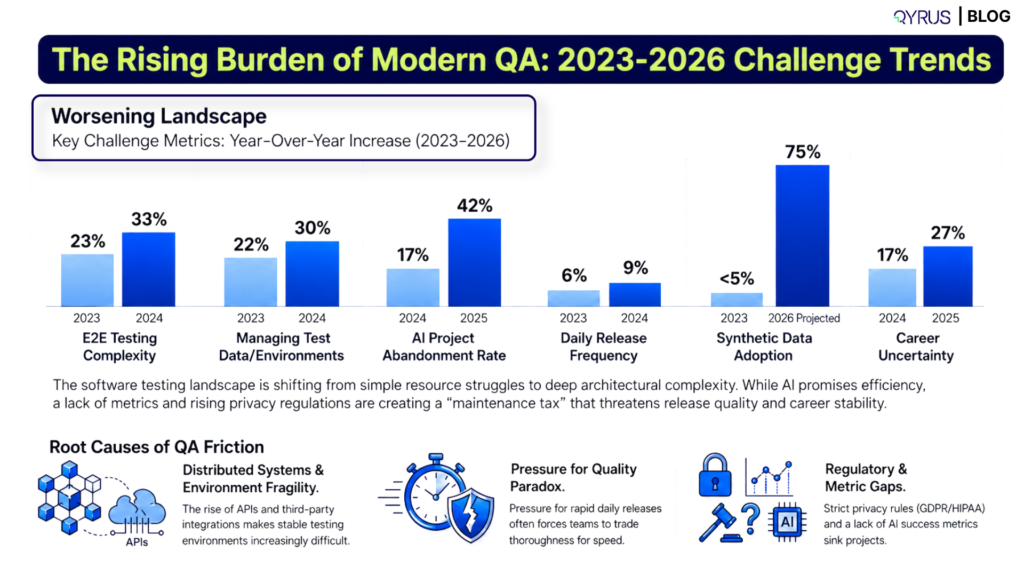
Test maintenance has always been a cost of automation. Teams have always had to update scripts when the application changes. What changed between 2023 and now is the rate of change — and the gap between how fast applications ship and how fast QA teams can keep up with the resulting breakage. 

What Actually Breaks Tests? It’s More Than Bugs 

This is the part that most teams find frustrating when they first audit where their maintenance time goes. The majority of test failures in a mature automation suite are not catching real defects. They are responding to cosmetic and structural changes in the application that have nothing to do with whether the feature works: 

Element ID or class name changes — a developer renames a CSS class or button ID as part of a refactor. Every test that references the old identifier breaks, even though the button still works exactly the same way 

Layout and position shifts — a component moves to a different location on the page, or its position in the DOM changes. Tests that used XPath selectors based on element position now point at the wrong element 

Label and copy updates — a button label changes from ‘Submit’ to ‘Continue’. Tests that matched on visible text now fail 

Third-party component upgrades — a UI library version bump changes how components render internally, breaking selectors that referenced internal library element IDs 

Environment-specific rendering differences — the same element renders differently in staging vs. production, or across browser versions, causing tests to pass in one environment and fail in another 

The Statistic That Explains the Test Maintenance Problem  

Our research across enterprise QA departments consistently finds that 35 to 40 percent of QA engineering time goes to maintaining test scripts that break due to application changes — not to finding or preventing defects. In a team of ten QA engineers, three to four of them are effectively working full-time on keeping existing tests alive. That is before any new test creation, strategy work, or exploratory testing. 

Why the problem compounds as suites grow 

The maintenance burden does not scale linearly with the size of the test suite. It scales faster. A suite of 500 tests is not five times harder to maintain than a suite of 100 — it is closer to ten times harder, for three reasons: 

  • Shared element references multiply breakage- when a navigation element that appears on every page changes, it does not break one test. It breaks every test that touches any page with that element. One change can cascade into dozens of failures across unrelated test cases 
  • Failure triage gets slower- in a small suite, finding the root cause of a failure is fast. In a large suite, a single underlying change can produce hundreds of distinct failure messages, each pointing at a different test case, each requiring individual investigation to confirm they share the same root cause 
  • Prioritization becomes impossible- when every run produces dozens of failures, teams lose the ability to distinguish between a failure that represents a real defect and a failure that represents a stale selector. Eventually, engineers start treating all failures as noise and stop investigating which is exactly the opposite of what automation is supposed to achieve 

The data reflects the same pattern. Capgemini’s World Quality Report finds that 30–40% of QA engineering time is spent on test maintenance rather than defect detection. Research on AI self-healing frameworks suggests that maintenance effort can be reduced by 40–60%. 

Real-world adoption is starting to show similar results: Peloton reported a 78% reduction in test maintenance after deploying AI-powered testing in 2025, saving more than 30 hours per month. 

What teams have tried — and why it only partially works 

Most QA teams have already tried to address the maintenance problem before reaching for AI. The standard approaches have real limitations: 

  • Switching to more stable selectors — teams move from brittle XPath selectors to data-testid attributes or aria labels, which are more intentional and less likely to break on cosmetic changes. This helps, but it requires developer cooperation on every new feature, and it does not help for third-party components or applications where adding test attributes is not possible 
  • Page object models — abstracting element references into a single layer reduces the number of places that need updating when an element changes. But it still requires manual updates — it just consolidates where those updates happen 
  • Reducing test scope — some teams respond to mounting maintenance costs by simply running fewer tests, deprioritising coverage of UI-heavy flows. This reduces maintenance work by reducing what there is to maintain, but it also reduces coverage and reintroduces the defect risk that automation was supposed to prevent 

None of these approaches address the root cause. They manage the maintenance burden more efficiently — they do not eliminate it. 

How AI Self-Healing Changes the Economics of Test Maintenance 

AI self-healing does not work by writing better selectors or by requiring developers to add test attributes. It works by teaching the automation layer to recover from element changes on its own, without human intervention. 

AI Self-Healing Changes the Economics of Test Maintenance

What self-healing actually does — specifically 

When a traditional automated test runs and cannot locate an element — because the ID changed, or the class was renamed, or the element moved — the test fails and stops. The failure gets added to the morning report. An engineer investigates, identifies the root cause, updates the locator, and re-runs the test. That process takes time every single time it happens. 

An AI self-healing system intercepts that failure at the moment it occurs. Instead of stopping, it analyses the page, compares the current state of the DOM against what it knows about the element from previous successful runs, and identifies the element that matches the expected behaviour and context — even though the specific identifier has changed. It updates the reference and continues the test. 

The test still runs. The result is still meaningful. The engineer does not get paged. The morning report shows a pass, not a maintenance ticket. 

The confidence is the problem — and why it matters 

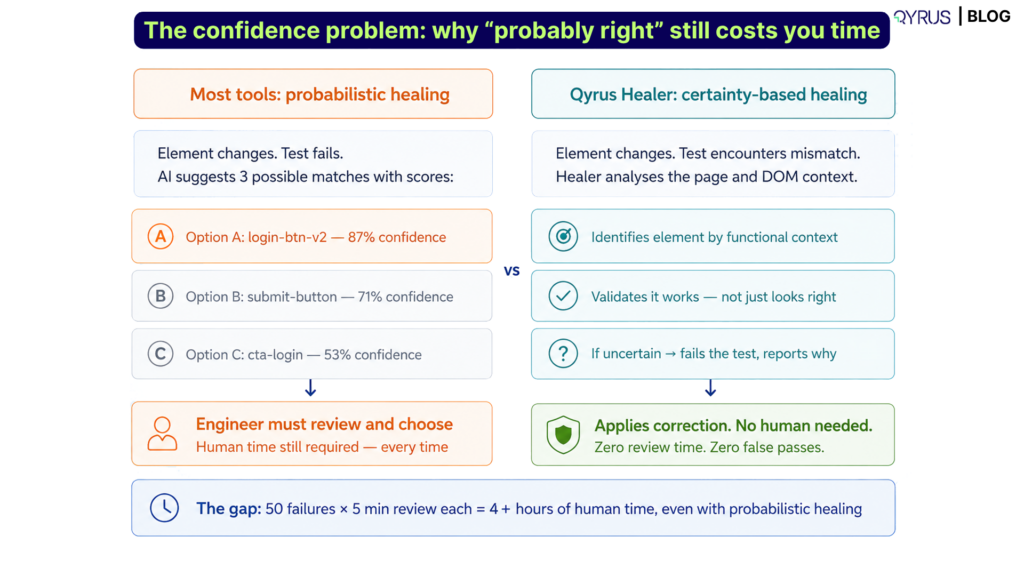
Most self-healing implementations have a limitation that reduces their practical value: they offer probable matches, not confirmed ones. When an element changes, the system identifies several candidates that might be the right element, assigns a confidence score to each, and presents the options for human review. The engineer still has to make the final call. 

This is better than no healing, but it still requires human time. If the engineer is reviewing ten candidate suggestions per failure and you have fifty failures per run, you have not eliminated maintenance time — you have just changed what kind of work it involves. 

The confidence is the problem — and why it matters

How Qyrus Healer approaches this differently 

Qyrus Healer does not offer candidate matches with confidence scores. It does not return a value unless it has established with certainty that the element it has identified is functionally correct. The distinction matters operationally: when Healer identifies a replacement locator, the engineer does not need to review it, verify it, or decide between options. The correction is certain, not probable. 

As Suraj from Qyrus’s client development team puts it: “Healer works on 100% certainty. It doesn’t provide a value unless it establishes functionality. Healer goes a step further than anything that’s out there.” Read the full conversation on healer here. 

What that looks like  

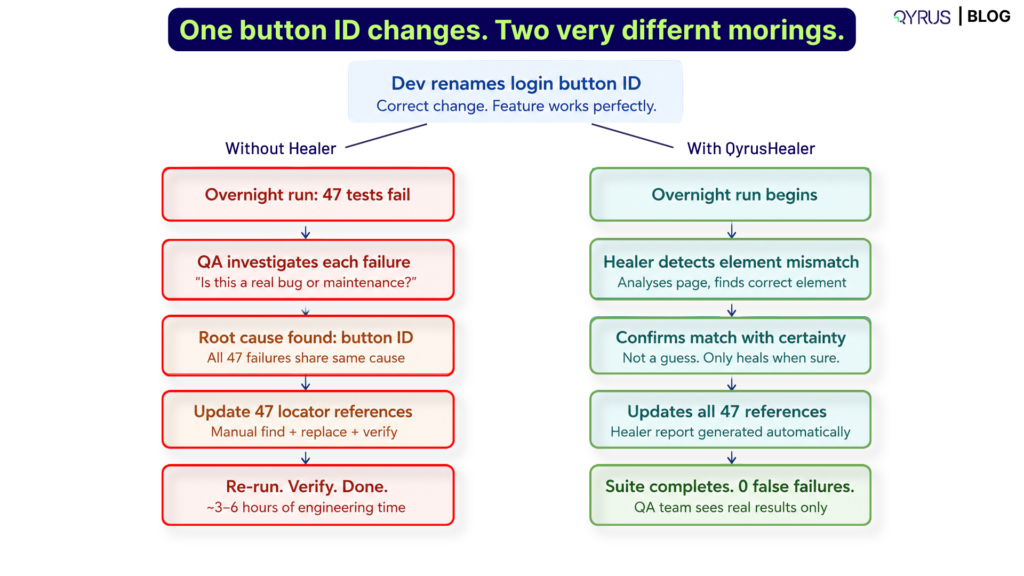
A team runs their regression suite overnight. During the day, a developer updated the ID attribute on the login button as part of a component refactor. The change was intentional and correct — the login feature works exactly as expected. 

Without Healer: every test that touches the login flow fails with an ‘object not found’ error. The QA engineer’s morning starts with investigating which tests failed, confirming they all share the same root cause, finding the correct new ID value, updating every affected test, and re-running to verify. Depending on how many tests reference the login button and how many other changes were made in the same sprint, this takes hours. 

With Healer: the test suite runs. When a test reaches the login button and cannot locate it by its old ID, Healer analyses the page, identifies the login button by its functional context and surrounding DOM structure, confirms it is the correct element, and updates the locator reference. The test continues. The suite completes. The morning report shows the actual state of the application — not a wall of maintenance failures. 

Who benefits — it is not just testers 

The impact of reducing test maintenance overhead extends beyond the QA team: 

  • QA engineers — less time on locator repair means more time on test strategy, coverage analysis, exploratory testing, and higher-value work that cannot be automated 
  • Developers — teams using Healer do not need to coordinate with QA every time they refactor a component or update element attributes. The tests adapt without intervention, which removes a friction point that slows down development velocity 
  • Business technologists and non-technical stakeholders — because Healer provides a detailed report of every healing event — what changed, what it was changed to, and why — business-side users can follow what is happening to their application’s test coverage without needing to understand automation internals 
  • Engineering managers — automation ROI improves when maintenance cost drops. A suite that was consuming a third of QA capacity on upkeep returns that capacity to work that creates value 

What Test Flakiness Is Actually Costing Teams 

What Test Flakiness Is Actually Costing Teams

Slower releases 

When a regression run produces a large number of failures, someone has to triage them before the team can make a release decision. If that triage requires distinguishing between real defects and maintenance failures — and it does, because you cannot ship on a failed suite without knowing which failures matter — the release is on hold until the investigation completes. In teams running weekly or biweekly releases, this consistently pushes release dates. 

Automation ROI that never materialises 

The business case for test automation is a reduction in manual QA effort and faster release cycles. When a significant portion of the automation budget is consumed by maintenance rather than execution, the ROI calculations that justified the automation investment do not hold.  

Teams that built automation expecting to reduce their QA headcount often find that the maintenance burden requires the same headcount — just doing different (and less valuable) work. 

Alert fatigue and the trust collapse 

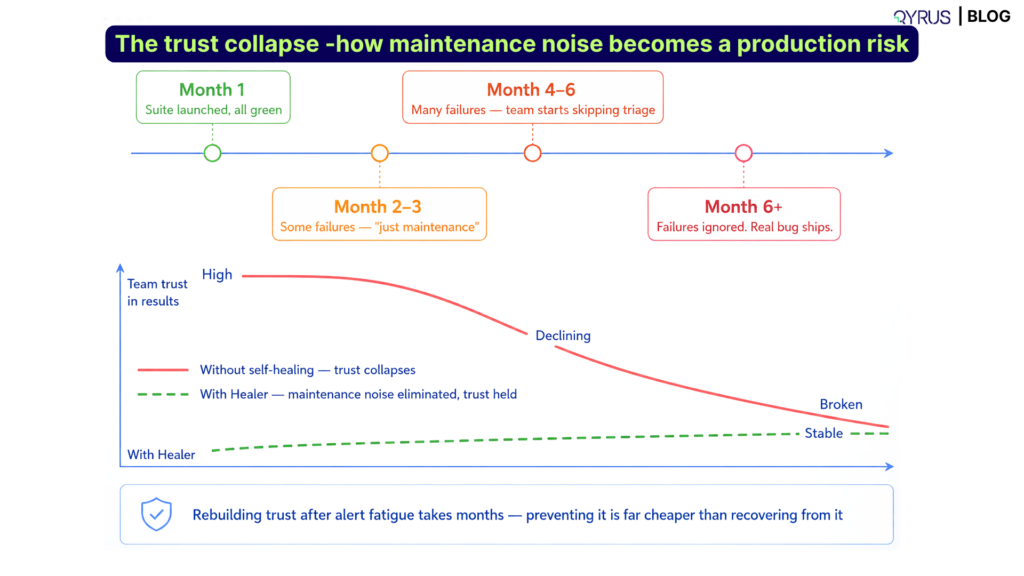
This is the failure mode that is hardest to recover from. When a team’s CI/CD pipeline consistently produces test failures that turn out to be maintenance issues rather than real defects, engineers learn to discount failure reports. They stop investigating quickly. They start assuming failures are probably not real. And then a real defect ships because it was mixed in with maintenance failures and nobody looked closely enough. 

Rebuilding trust in a test suite after alert fatigue has set in requires more than fixing the maintenance problem — it requires demonstrating to the team, over time, that failures now reliably mean something. That takes months. 

Developer velocity issue 

Every time a developer makes a legitimate, correct change to the UI and the test suite breaks, there is a cost: investigation time, coordination with QA, and sometimes rollback pressure if the maintenance cannot be completed before a deadline. Teams that have not solved the maintenance problem often find that developers start avoiding UI changes that are technically correct but ‘not worth the testing fight.’ The automation is actively constraining what the development team will build. 

Qyrus Healer: What It Does and How It Fits Into Your Workflow 

Healer is Qyrus’s AI-powered self-healing engine, built specifically to address the locator fragility problem that accounts for the majority of test maintenance effort. It works across both web and mobile automation, integrates with the existing Qyrus test suite, and operates without requiring manual review of its corrections. 

 How Healer works 

When a test encounters an element it cannot locate using its existing selector, Healer activates. It analyses the current state of the application, cross-references it against the element’s known functional context and historical locator information, and identifies the correct element with certainty before updating the reference. The test then continues from that point. 

Healer does not use a probabilistic matching approach that presents options. It identifies the correct element definitively, or it does not offer a correction at all. This means the corrections it makes do not require human sign-off — they are implemented with the same confidence as a manually verified locator update. 

What Healer reports back 

Every healing event generates a Healer report that logs exactly what changed: the original locator value, the new locator value, the test case and step affected, and the element on the application that was updated. This reporting serves two purposes: it creates an audit trail for teams that need to track what is happening to their test suite over time, and it gives business technologists and non-technical users visibility into the health of their automation coverage without requiring them to read test code. 

Where Healer applies 

Healer works across the Qyrus platform’s full testing scope — web automation and mobile automation — which means the same self-healing capability that covers your web UI tests also covers your native iOS and Android tests. In mobile testing, where element identifiers shift frequently between OS updates, device variants, and manufacturer  customizations, self-healing has a particularly high impact on maintenance reduction. 

What Healer is not 

Healer does not fix tests that are failing because of real application defects. If a button is broken, Healer will not make the test pass — it will report the failure accurately. Self-healing addresses the false positive problem: tests that fail because of element changes, not because the application is broken. When a failure is real, it surfaces as a real failure. This is the distinction that makes Healer useful rather than dangerous — it reduces noise without hiding signal. 

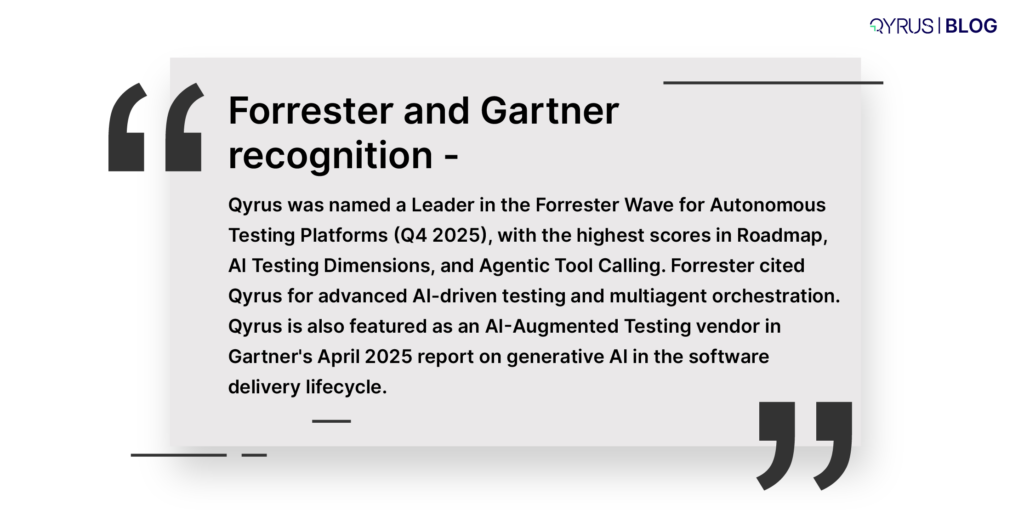
Forrester and Gartner recognition 

Qyrus was named a Leader in the Forrester Wave for Autonomous Testing Platforms (Q4 2025), with the highest scores in Roadmap, AI Testing Dimensions, and Agentic Tool Calling. Forrester cited Qyrus for advanced AI-driven testing and multiagent orchestration. Qyrus is also featured as an AI-Augmented Testing vendor in Gartner’s April 2025 report on generative AI in the software delivery lifecycle. 

What to Actually Look for When Evaluating AI Self-Healing Tools 

Self-healing has become a marketing term that many testing tools claim. Before adopting any solution, there are specific questions that distinguish implementations that reduce maintenance cost from ones that simply rename the problem: 

Does it heal with certainty or with probability? 

Probability-based healing — where the system offers candidate matches and the engineer chooses — still requires human time. Certainty-based healing — where the system identifies the correct element definitively and applies the correction without review — is the version that actually eliminates maintenance hours. Ask vendors to demonstrate what happens when an element changes: does the tool fix it automatically, or does it surface options for a human to approve? 

Does it work on both web and mobile? 

Element fragility exists on both platforms, and the mobile version of the problem is arguably worse because of OS updates, manufacturer-specific rendering, and the speed at which mobile frameworks evolve. A self-healing solution that only covers web automation leaves the mobile maintenance problem intact.  

What does the reporting look like? 

Self-healing without reporting creates a different problem: your tests are passing, but you do not know why locators keep changing. Good self-healing tooling provides a complete audit trail of every healing event — what changed, when, in which test, and to what value. This is what allows teams to monitor UI change patterns and understand whether the healing is covering legitimate application evolution or signalling a more systematic problem. 

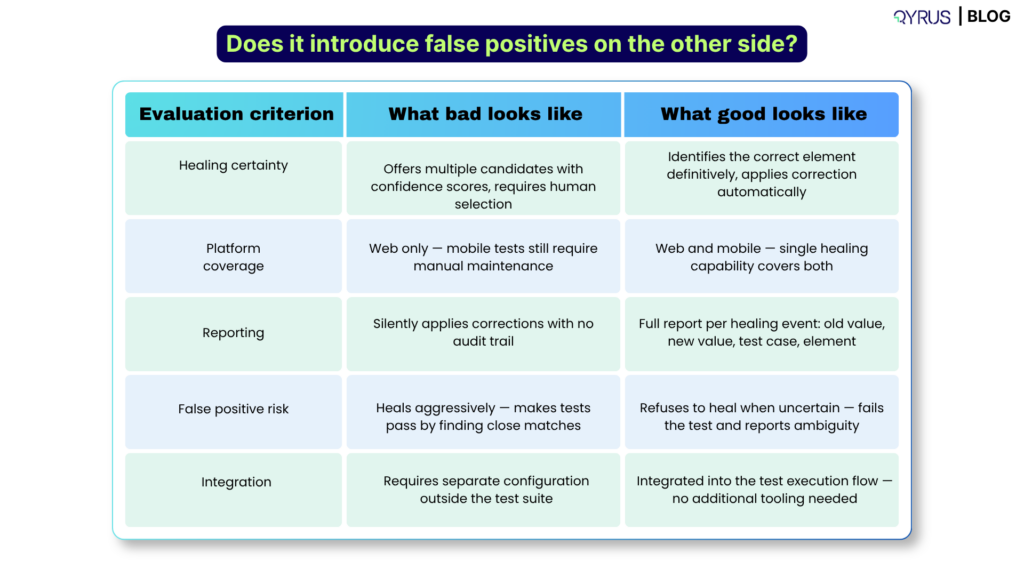
Does it introduce false positives on the other side? 

A self-healing system that is too aggressive will make tests pass when they should fail — by identifying a ‘close enough’ element that is not actually the right one. This is worse than the original maintenance problem, because it creates false confidence. Ask specifically how the tool handles ambiguous cases: does it heal when uncertain, or does it fail the test and report that it could not identify the correct element with confidence? 

When Evaluating AI Self-Healing Tools 


Evaluation criterion 

What bad looks like 

What good looks like 

Healing certainty 

Offers multiple candidates with confidence scores, requires human selection 

Identifies the correct element definitively, applies correction automatically 

Platform coverage 

Web only — mobile tests still require manual maintenance 

Web and mobile — single healing capability covers both 

Reporting 

Silently applies corrections with no audit trail 

Full report per healing event: old value, new value, test case, element 

False positive risk 

Heals aggressively — makes tests pass by finding close matches 

Refuses to heal when uncertain — fails the test and reports ambiguity 

Integration 

Requires separate configuration outside the test suite 

Integrated into the test execution flow — no additional tooling needed 

Conclusion 

The test maintenance problem is not going away on its own. Every sprint that ships UI changes produces new maintenance work. Every expansion of the test suite creates more surface area for that work to compound. And every hour a QA engineer spends updating locators instead of finding defects is an hour the automation ROI calculation moves in the wrong direction. 

AI self-healing does not fix every part of this problem — it does not address flakiness caused by timing, or failures caused by real defects, or the strategic question of which tests to write. What it does address is the single largest category of test maintenance cost: tests breaking because identifiers changed, elements moved, or labels were updated, when the underlying functionality is completely intact. 

When that category of failure is handled automatically, the morning report becomes meaningful again. Engineers investigate failures that represent real problems. Releases do not wait on locator triage. The suite grows in coverage without growing proportionally in maintenance burden. 

Request a demo to see how Qyrus Healer can reduce your test maintenance overhead and give your QA team back the time they are currently spending keeping broken tests alive. 

Featured image

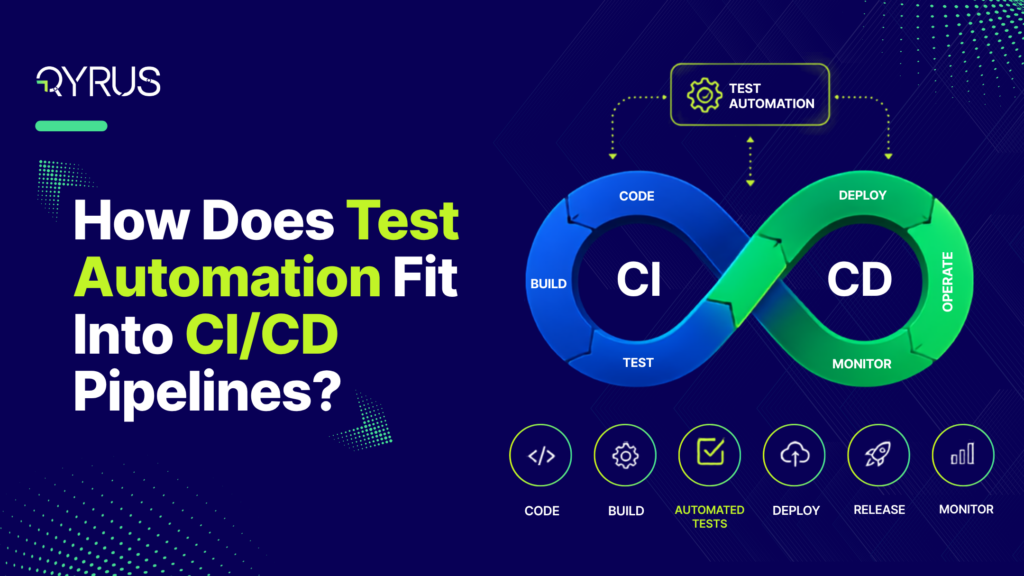
Test automation fits into a CI/CD pipeline as the validation layer that runs at every stage between a code commit and a production release. Each stage runs the fastest tests capable of catching failures at that point in the pipeline: unit tests on commit, integration and API tests on merge, end-to-end and regression tests before deployment — and quality gates decide whether code is allowed to move forward. Done well, automation is what lets a team deploy quickly without shipping broken software. 

That last point is where most teams struggle. Continuous integration and continuous delivery pipelines were built for speed: build fast, test fast, and fail fast. But a test suite dropped into the pipeline in the wrong place does the opposite. A forty-five-minute end-to-end run on every pull request forces developers to wait, batch their changes, and merge larger chunks of code — which produces bigger, harder-to-debug failures. The question, then, is not whether to automate. It is where each test earns its place. 

What CI/CD Pipelines Actually Do — and Why Testing Is the Load-Bearing Wall 

A CI/CD pipeline automates the path from source code to running software. Continuous integration is the practice of merging code changes into a shared branch frequently, with an automated build and test run verifying each change. Continuous delivery extends that by automatically preparing every validated build for release, so deployment becomes a routine, low-risk event rather than a quarterly ordeal. 

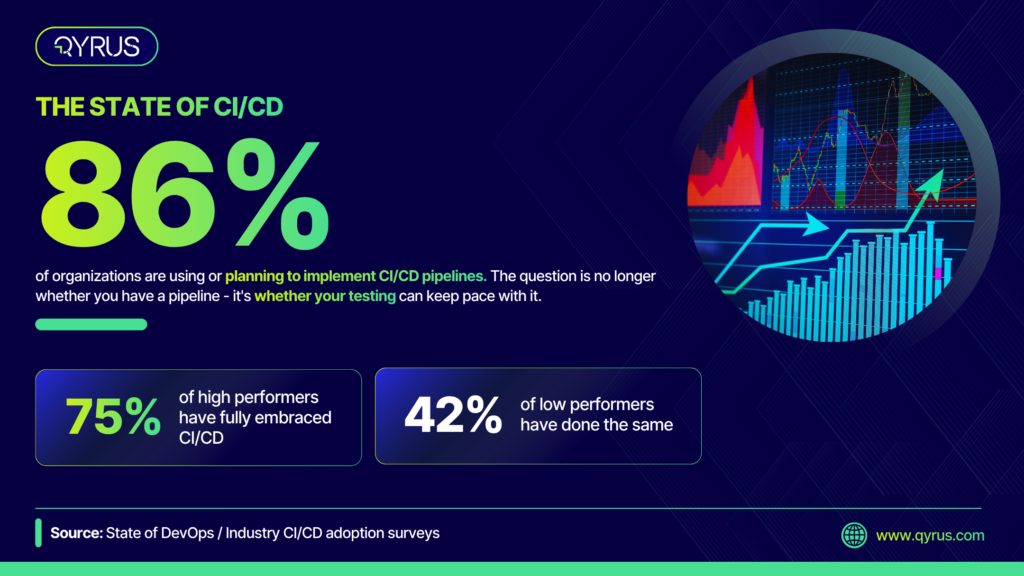
 CI/CD pipelines are now the default way modern teams deliver software. Industry surveys report that 86% of organizations are either using or planning to implement CI/CD pipelines, and the gap between leaders and laggards is stark: 75% of high-performing organizations have fully embraced CI/CD, compared with only 42% of low performers. Adoption has moved past the question of whether you have a pipeline to whether your testing can keep pace with it. 

This is where automated testing becomes the load-bearing wall. Without it, continuous integration simply packages code faster — it does not tell you whether that code works. The pipeline will happily build, deploy, and ship a broken change at high speed. Automation is the mechanism that turns a build system into a quality system. 

The payoff shows up in the delivery data. Across more than a decade of DORA research, elite performers deploy roughly 182 times more frequently than low performers while maintaining around 8 times lower change failure rates. Speed and stability move together rather than trading off — and continuous, automated testing is the mechanism that makes that combination possible. You cannot deploy on demand and sleep at night unless a reliable test layer is validating every change on the way through. 

Hero Stat

Where Each Test Type Belongs: Mapping the Pyramid to Pipeline Stages 

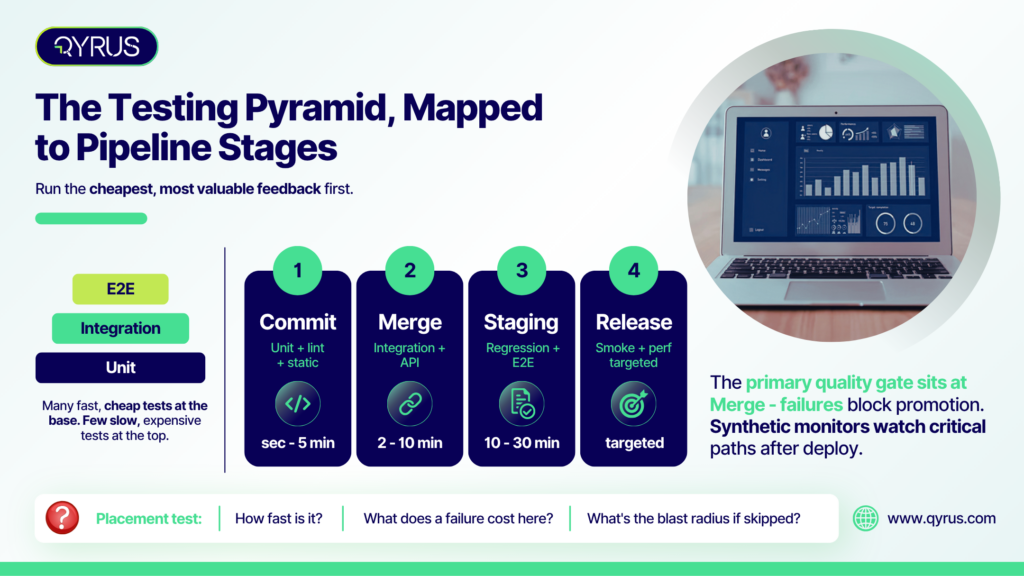
The classic testing pyramid — a broad base of fast unit tests, a middle layer of integration tests, and a thin top layer of end-to-end tests — is usually taught as a ratio. In a pipeline, it is better understood as a map of where each test type runs. The guiding principle is simple: run the cheapest, most valuable feedback first, and reserve slow, expensive checks for the stages where they add unique confidence. 

Commit stage: unit tests, linting, static analysis 

Every commit triggers the fastest checks: unit tests that validate individual functions in isolation, plus linting and static code analysis. This stage answers one question: “Did I break anything obvious?” It has to answer it in seconds to a few minutes. Fast feedback here keeps the code fresh in the developer’s mind and stops trivial errors from ever reaching a teammate. 

Pull request / merge: integration and API tests 

When a change is proposed for merge, the pipeline runs integration and API tests against a deployed test environment, verifying that components and services work together. This is typically the primary quality gate: failures here block the merge. Because API tests validate business logic directly without a browser, they run far faster than UI tests and catch a large share of defects before they ever reach the interface. 

Post-merge / staging: full regression, end-to-end, cross-browser and device 

After changes merge to the main branch, the pipeline runs the heavier suites — full regression, end-to-end user journeys, and cross-browser or cross-device validation — in an environment that mirrors production. This stage confirms that the combined changes from multiple merges do not produce emergent defects. It runs on a schedule or on deployment rather than on every commit, so its longer runtime never blocks a developer waiting for feedback. 

Pre-production / release: smoke, performance, and visual regression 

Before a build is promoted to production, a focused set of smoke tests validates the critical paths, while performance and visual regression tests confirm the release behaves and looks correct under realistic conditions. These are targeted checks, not a re-run of everything. 

Post-deployment: synthetic monitoring 

The pipeline’s job does not end at release. Synthetic monitors continuously exercise critical production paths after every deployment, catching issues that only surface with real infrastructure and real traffic. 

A simple placement framework 

When you are unsure where a test belongs, ask three questions. How fast is it? Faster tests run earlier and more often. What does a failure cost at this stage? The later a defect escapes, the more it costs to fix — so high-cost failures deserve an earlier gate. And what is the blast radius if you skip it here? Tests guarding payments, authentication, or data integrity earn a place in more stages than cosmetic checks do. Getting this placement right is the difference between a pipeline that accelerates delivery and one that grinds it to a halt. 

Pyramid Pipeline

Quality Gates: The Decision Logic Between Stages 

If test placement decides which tests run where, quality gates decide what happens next. A quality gate is an automated checkpoint that evaluates whether a change meets predefined criteria — all unit tests passing, code coverage above a threshold, no critical or high-severity vulnerabilities, performance within an acceptable range — before it is allowed to advance to the next stage. If the criteria are met, the change passes. If not, the pipeline halts until the issue is resolved. 

The discipline this enforces is the whole point. As one common formulation puts it, if a failing test does not stop the build from moving forward, your automation is purely decorative. Gates turn test results from information into enforcement. 

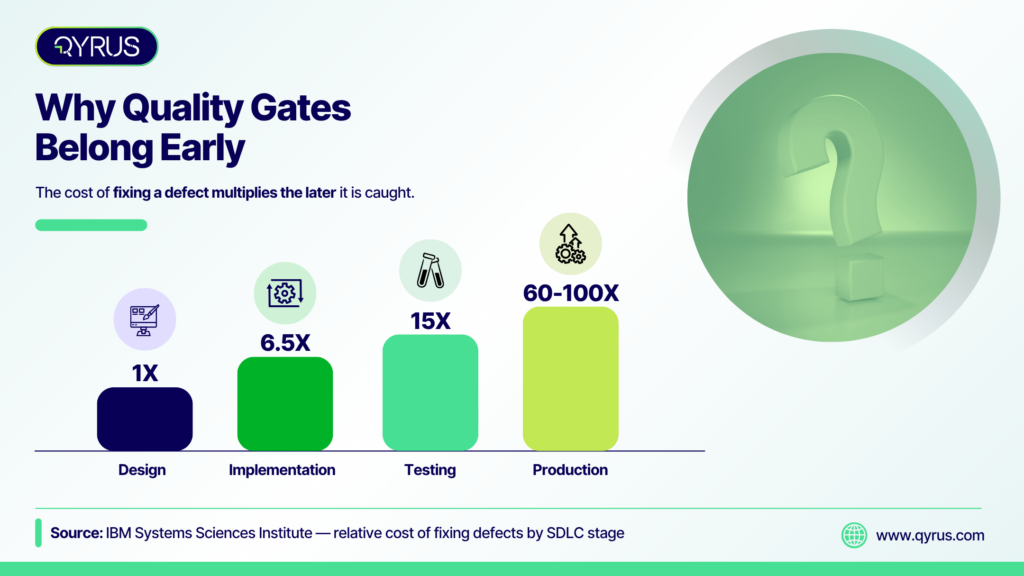
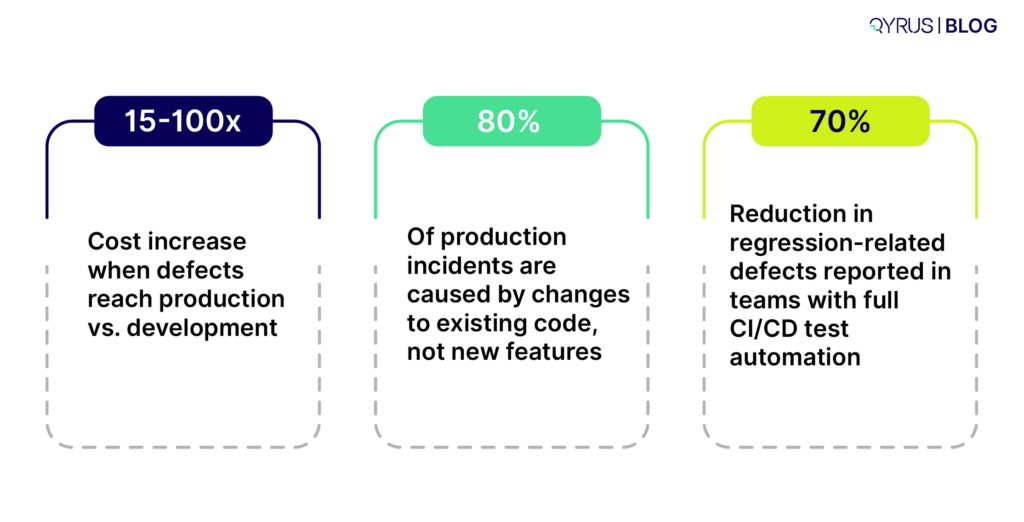
The economics justify gating early and often. The IBM Systems Sciences Institute’s long-cited research on defect cost found that fixing a bug grows dramatically more expensive the later it is caught: roughly 1x during design, 6.5x during implementation, 15x during testing, and 60 to 100x once the software is in production. A gate that blocks a defective change at the merge stage is not bureaucracy. It catches a problem while it still costs a fraction of what it would after release. This is the economic engine behind shift-left testing: placed at multiple stages, gates create layered validation, with each checkpoint catching a different class of issue at the point where it is cheapest to fix. 

Defect Cost

The Failure Mode: When Test Automation Breaks Your Pipeline Instead of Protecting It 

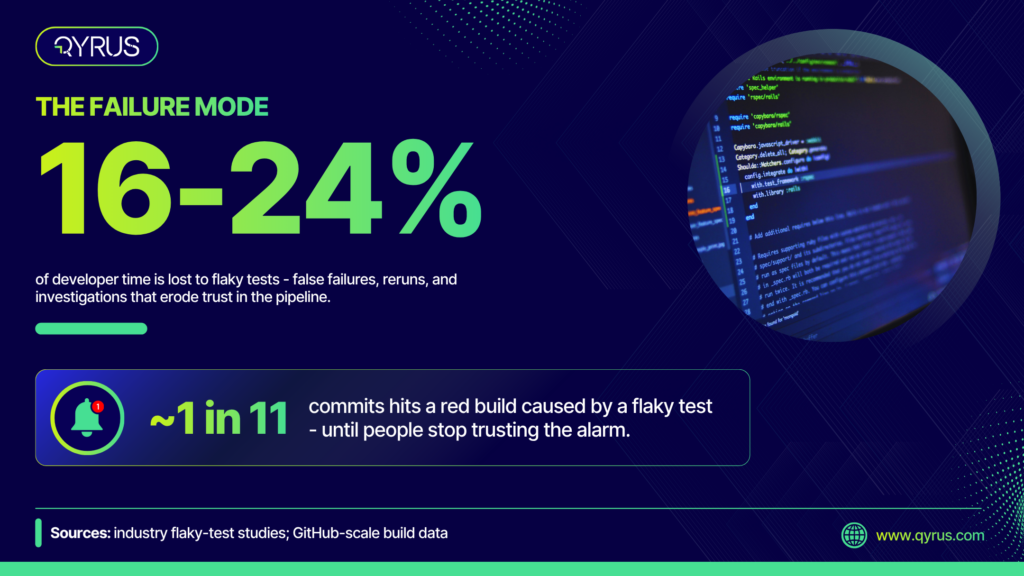
Automated testing only helps if the pipeline trusts its results. The fastest way to lose that trust is flaky tests — tests that pass or fail inconsistently without any change to the code. The cost is larger than it looks. Studies place the developer time lost to flaky tests, through false failures, reruns, and investigations, at roughly 16 to 24% on average, and GitHub-scale data has found that around one commit in eleven hit a red build caused by a flaky test. 

The damage compounds. When a green checkmark stops meaning the code is good, developers start clicking rerun instead of investigating — and eventually real failures slip through because nobody believes the alarm anymore. The test suite decays from an early-warning system into background noise. 

Slow suites cause a related failure.  When feedback takes too long, developers batch larger changes to avoid the wait. Each failure becomes larger and harder to isolate, making the suite feel even slower. And underneath both problems sits the maintenance tax: brittle, hard-coded locators that snap the moment a designer renames a CSS class or shifts a layout, turning a routine UI change into a suite full of red that found no real bug at all. This is exactly the problem self-healing test automation is built to solve. 

None of this is an argument against automation. It is an argument for automation that is fast, isolated, and resilient enough to survive the pace of real development — which is precisely where the newest generation of tooling is focused. 

Flaky Test Cost

What Modern Pipelines Add: AI-Assisted Testing in CI/CD 

 The direction of pipeline testing in 2026 is intelligence about what to run and self-maintenance of what breaks. Three capabilities lead the shift. Test impact analysis uses the change itself to determine which tests are actually relevant, running a targeted subset instead of the entire suite on every pull request. Self-healing automatically repairs locators when the interface changes, so a legitimate UI update no longer turns the pipeline red. And flake detection identifies and quarantines unreliable tests before they erode trust in the signal. 

There is a sharper reason this matters now. DORA’s 2025 research found that AI adoption tends to improve throughput by an estimated 2 to 18%, but often at the cost of declining stability and higher change failure rates. In other words, teams are shipping more code, faster, with AI assistance — and pushing more of it through the pipeline. That makes the automated test layer more critical, not less. When more change flows through the same gates, the gates have to be smart enough to keep up. 

This is the point where a pipeline stops being a set of scripts that run tests and starts becoming an orchestrated system that decides what to test based on what changed. Teams ready to go deeper on that shift can read how agentic orchestration tames the CI/CD pipeline as the advanced companion to this guide. 

How Qyrus Fits Into Your CI/CD Pipeline 

Qyrus is designed to plug into the pipeline you already run rather than replace it. It offers native integrations with the major CI/CD servers — Jenkins, Azure DevOps, Bitrise, TeamCity, and Concourse — so a code push or a completed build can trigger the right tests automatically, with no manual handoff. 

Because Qyrus covers web, mobile, and API testing on a single platform, it maps cleanly onto the stage model described above. API tests can run early for fast backend validation; web and mobile regression can run mid-pipeline across cloud-based browser and device farms; and orchestrated end-to-end flows can validate a complete business process before release. That cross-module reach matters in a world where a single user journey often spans an API, a website, and a mobile app. 

Qyrus also addresses the failure mode from earlier in this guide directly. Healer is an AI feature that finds new locators for steps that break when the application changes, referencing a passing baseline to repair scripts instead of failing them — reducing the maintenance tax and the flakiness that erode pipeline trust. And rather than a bare pass or fail, Qyrus feeds granular, step-by-step results, screenshots, and visual reports back into the pipeline, so a red build tells you exactly what broke and where. 

The results show up in practice. A Fortune 500 waste management company integrated Qyrus automated API testing with Jenkins and, over three months, built 4,500 unique test cases — achieving a 10x increase in coverage, a 50% decrease in execution time, and zero API bugs leaked into production across the following 24 months. More broadly, a Forrester Total Economic Impact study of the Qyrus platform reported a 213% return on investment with a payback period of under six months, and a 70% reduction in test building time through AI-driven, codeless features. 

Frequently Asked Questions 

What is the role of test automation in CI/CD? 

Test automation is the validation layer of a CI/CD pipeline. It runs automated checks at each stage — from commit through deployment — to confirm that code changes work as expected before they advance. This is what allows teams to release frequently without relying on slow manual testing as a bottleneck. 

Which tests should run on every commit? 

Fast, isolated checks belong on every commit: unit tests, linting, and static code analysis. They provide feedback in seconds to a few minutes and catch obvious errors while the code is still fresh. Slower integration and end-to-end tests run later, at merge and deployment stages, so they do not hold up developers. 

What is a quality gate in a CI/CD pipeline? 

A quality gate is an automated checkpoint that decides whether a change can move to the next stage. It evaluates criteria such as passing tests, code coverage thresholds, and the absence of critical vulnerabilities. If the criteria are not met, the pipeline stops until the issues are fixed. 

How do you keep automated tests from slowing down the pipeline? 

Order tests by speed so the fastest run first, run only the tests relevant to a change where possible, and execute tests in parallel. Reserve slow end-to-end suites for later stages rather than every commit. Keeping the developer-facing feedback loop under about ten minutes is a common target. 

What causes flaky tests in CI/CD? 

Flaky tests usually stem from timing issues, unstable test environments, test pollution, or brittle locators that break when the UI changes. They pass or fail inconsistently without any code change, which erodes trust in the pipeline. Isolating tests, using resilient selectors, and self-healing automation all help reduce flakiness. 

Can AI improve test automation in CI/CD pipelines? 

Yes. AI is increasingly used to prioritize which tests to run based on code changes, to self-heal broken locators so UI updates do not cause false failures, and to detect and quarantine flaky tests. These capabilities become more valuable as AI-assisted development pushes more code through the pipeline. 

Conclusion 

Test automation does not fit into a CI/CD pipeline as a single stage or a box to check at the end. It fits as a layered validation system with the right tests running at the right stage, enforced by quality gates, kept trustworthy by resilient tooling. The teams that get this right are not the ones that automate the most tests, but the ones that place each test where it earns its confidence for the least delay. 

Qyrus helps teams do exactly that, plugging into your existing CI/CD tools and covering web, mobile, and API testing across every pipeline stage. To see how it fits your workflow, request a demo. 

thumbnail

Here is how most cross-device UX defects get discovered: a user leaves a one-star review mentioning that the checkout button is cut off on their phone. Or a support ticket comes in saying the app freezes on the payment screen. Or someone from the QA team happens to test on their personal device the week before launch and notices the login form is completely broken in landscape mode. 

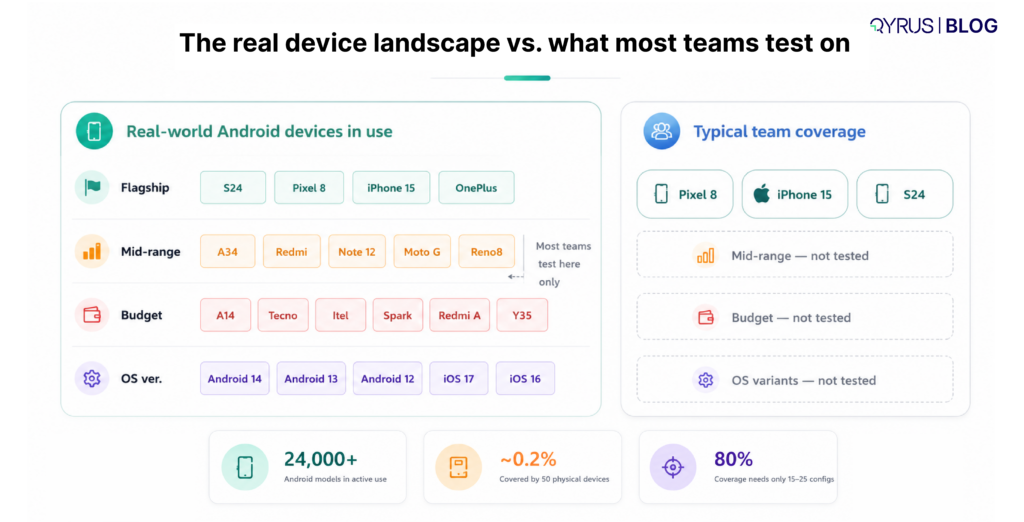
None of those are edge cases. They are the normal outcome of a testing approach that checks too few devices, relies too heavily on emulators, and treats cross-device validation as a box to tick rather than a specific discipline with specific failure modes. 

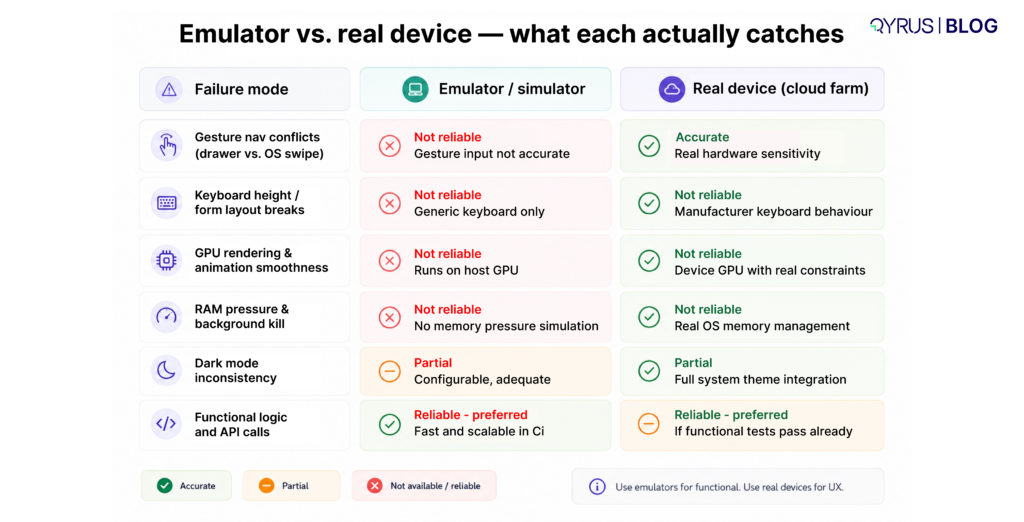
Our guide skips the obvious parts — yes, you need to test on mobile, yes, screen sizes differ. Instead, it covers the questions that QA teams actually struggle with: which failure modes matter most and why, what emulators genuinely cannot catch, how to build a device coverage strategy that reflects your real users, and where Qyrus fits into all of it. 

The Failure Modes That Actually Reach Production 

Gesture issues with OS navigation 

Android has shipped three navigation models since 2019 — three-button, two-button, and full swipe gestures. The swipe-from-edge gesture that triggers OS-level back navigation directly conflicts with in-app gestures: side drawer menus, swipeable carousels, bottom sheets, and horizontal scroll containers all compete for the same screen edge. On older devices with three-button navigation, your drawer opens fine. On a newer device using gesture nav, the same swipe sends the user out of the app entirely. 

This does not show up in emulator testing because gesture navigation in emulators is inconsistent and does not replicate the sensitivity of real hardware input. It shows up in user reviews saying ‘I can’t open the menu’ — on specific devices, from specific OS versions onwards. 

Keyboard behaviour that breaks form layouts 

We all know that virtual keyboard height is not standardized. Gboard, Samsung Keyboard, MIUI Keyboard, and third-party keyboards all have different default heights, animation curves, and emoji/suggestion panel behaviour.  

When the keyboard appears, it either pushes layout content upward or overlaps it — and which behaviour happens depends on how the view is configured, which keyboard is active, and which device it is running on. 

The result: a form that is fully visible on your reference device has its submit button pushed below the viewport on a device with a taller keyboard. The user cannot complete the form without knowing to dismiss the keyboard first. Many do not know that. They leave. 

real device

Dark mode is not consistent across screens 

Dark mode adoption sits between 55 and 82 percent depending on the demographic — for most apps, it is the majority experience. Yet it is still tested as just a basic functionality, if at all.  

The specific failures are consistent across codebases: hardcoded colour values that do not respond to the system theme (producing black text on a black background), images with transparent backgrounds that assume a white canvas, and mixed-mode screens where the app header follows the theme but a modal component does not. 

These are invisible if you test only in light mode on a single device. They are the first thing a user sees when they open the app at night. 

Performance falls in mid-range and budget hardware 

Development teams test on recent flagships or high-spec simulators. The median Android device shipped to users in Southeast Asia, Latin America, and South Asia — markets that represent enormous mobile user bases — has 3–4GB RAM, a mid-tier GPU, and aggressive OS-level memory management that kills background processes faster than any flagship device would. 

Animations that run at 60fps on a Pixel 8 drop frames on a Redmi. JavaScript-heavy screens that load in under a second on a Galaxy S24 take three to four seconds on a budget Tecno or Itel device. Scroll performance that feels fluid in development feels like dragging in production for a significant portion of your users. 

A survey by QualityAI/Google Consumer Surveys found that 88% of app users would abandon apps based on bugs and glitches, and 37% said they were likely to stop using an app the moment they experienced a bug. 

Google has highlighted that memory requirements and device limitations are major reasons users uninstall or abandon apps, and more than 90% of users would reconsider an app if the underlying issue were fixed. 

There’s more: 
Research on load-time impact shows that mobile abandonment rises sharply as pages slow down, with one study reporting 53% mobile abandonment and significant drop-offs as load times increase 

Font rendering and text overflow 

System font rendering differs across manufacturers. A label that sits cleanly within its container on one device truncates mid-word on another. The problem is amplified by accessibility settings: users running Large or Extra Large system font sizes — a meaningful accessibility use case — see every text element scale up, which breaks layouts designed with fixed font-size assumptions. Testing at default font size only tests the experience of users who have never adjusted their display settings. That is not most users.  

Orientation and foldable form factor edge cases 

Rotation handling is one of the most consistently broken mobile behaviours, and one of the least tested. An app that handles portrait correctly may reset its state on rotation — losing form input, resetting a video, navigating back to the home screen.  

For foldable devices (Galaxy Z Fold/Flip, and similar), there are two distinct display states and a transition between them. Apps that do not handle that transition gracefully crash, freeze, or present a broken layout to a growing segment of users who specifically chose a foldable device because they expected apps to work well on it. 

What Emulators Cannot Do? 

emulator

This question comes up constantly, and the answer is usually vague: ’emulators aren’t as accurate as real devices.’ Here is what that means in concrete terms. 

What you are testing 

On an emulator 

On a real device 

Gesture navigation conflicts 

Cannot replicate — emulator gesture nav is inconsistent 

Accurate — real hardware input, real OS sensitivity 

Keyboard height and behaviour 

Generic — does not vary by manufacturer keyboard 

Accurate — real keyboard, real push/overlap behaviour 

GPU rendering and animation smoothness 

Not possible — runs on host machine GPU 

Accurate — device GPU with real thermal constraints 

RAM pressure and background kill 

Not available — no memory pressure simulation 

Observable — real OS memory management 

Manufacturer OS customisation 

Not available — only stock Android/iOS 

Accurate — real OneUI, MIUI, OxygenOS behaviour 

Dark mode across system components 

Configurable — adequate for basic checks 

Accurate — full system theme integration 

Foldable form factor transitions 

Limited — emulator support still unreliable 

Required — only real hardware validates transitions 

Real network radio behaviour 

Simulated — WiFi throttling only 

Accurate — real 4G/5G signal variation 

The point is not that emulators are useless. For functional validations like, does this API call succeed, does this form submit, or does this navigation route work, emulators are fast, scalable, and appropriate. The problem is using them as a substitute for real-device testing when the question being asked is ‘does this feel right and render correctly for real users on real hardware.’ That question requires real hardware. 

How to Build a Device Coverage Matrix That Reflects Real Users 

The most common mistake in device coverage planning is selecting devices based on what is available — whatever is in the office drawer, whatever the cloud provider surfaces first, whatever the team owns personally. The coverage matrix should be derived from data about actual users, not convenience. 

Start with your analytics, not your assumptions 

Pull the device and OS breakdown from your analytics platform for the last 90 days. Identify the combinations that represent 80% of your active users. That list which is not a generic ‘top devices’ ranking, is your coverage priority. A financial app serving users in India will have a fundamentally different top-device list than a gaming app serving users in Germany. They should not have the same test matrix. 

Build three tiers, not one 

Once you have your user data, split it into three hardware tiers: 

  • Flagship tier — devices with current-generation processors, 8GB+ RAM, high-density displays. Validates that the experience is correct on the best hardware your users own 
  • Mid-range tier — devices with 4–6 GB RAM, mid-tier processors from one to two generations back. This is the median hardware for most global user bases and the tier where performance issues first appear 
  • Budget tier — devices with 2–3 GB RAM, entry-level processors, and aggressive OS memory management. This is where your experience breaks first, and where the largest user growth is happening in high-growth markets 

Testing only the flagship tier validates the experience for your least representative users. Every team does this. Almost no team does it intentionally. 

What to Actually Test, and in What Order? 

Given limited time and real-world release pressure, not every test gets to run on every device. Here is how to prioritise: 

Tier 1: Run on every device in your matrix, every release 

  • Core user journeys end-to-end (onboarding, login, primary transaction flow, account management) 
  • Visual rendering of every primary screen at default font size and at Large system font 
  • Dark mode rendering — every screen, not a sample 
  • Form submission including keyboard appearance and layout shift 
  • Navigation gestures — back, drawer open, tab switching 

Tier 2: Run on flagship and mid-range devices, every release 

  • Orientation change and state preservation across the full user journey 
  • Performance profiling on the primary transaction screens — frame rate and load time 
  • Network degradation — complete core flows on a throttled 3G connection 
  • Accessibility — touch targets, contrast, screen reader navigation 

Tier 3: Run on the full matrix before major releases 

  • Full regression suite across all configured device and OS combinations 
  • Foldable device transitions (if applicable) 
  • Battery and thermal — extended session testing 
  • Visual regression diff across all screens — compare against last approved baseline 

The Real Device Farm Question: What It Actually Gets You 

Cloud device farms are the standard answer to the scale problem — access to hundreds of real devices without maintaining a physical lab. The decision to use one is easy. The decision about which one, and how to evaluate it, is where teams go wrong. 

What matters most in a device farm — specifically 

  • Real devices, not VMs — some providers run tests on virtualised hardware that mimics device behaviour. This is not the same as a real device. Manufacturer OS customisations, real GPU rendering, and memory pressure behaviour only exist on actual hardware. Verify explicitly that the farm runs tests on physical devices 
  • The right devices, not the most devices — a farm with 3,000 devices is not useful if it has 2,800 iPhones and 200 Androids when your users are 70% Android. Evaluate coverage against your specific device matrix, not aggregate inventory numbers  
  • Parallel execution without throttling — the operational value of a device farm is running on 40 devices simultaneously in the time it takes to run on one. Farms that queue popular devices during peak hours negate this. Ask specifically about availability SLAs for the device models in your matrix.  
  • Video and log access on failure — when a test fails on a specific device configuration, you need the session recording, the device log, and ideally live access to reproduce the issue. Without this, a device farm produces failures you cannot diagnose 
  • Stable test script compatibility — moving from local automation to a cloud farm introduces configuration overhead. Appium session setup, app upload workflows, capability specification — factor this into the real cost of adoption, not just the subscription price 
question most teams ask

How Qyrus Handles This 

The failures described in this guide — gesture conflicts, keyboard layout breaks, rendering inconsistency across manufacturers, performance collapse on budget hardware — are exactly the failure modes Qyrus’s mobile testing platform and real device cloud are built to surface. 

Trust real devices, not simulations 

Qyrus runs mobile tests on physical Android and iOS hardware across a broad matrix of manufacturers, OS versions, and hardware tiers. This matters because manufacturer-level OS customisations — MIUI, OneUI, OxygenOS — only exist on real devices. The gesture conflicts, keyboard behaviours, and memory management differences that produce production defects cannot be replicated in a virtualised environment. Qyrus does not use VMs for device testing. 

Use visual regression that runs automatically 

Qyrus captures screenshots across the full device matrix on every test run and uses AI-based comparison to detect rendering differences against a known baseline. The comparison is semantic, not pixel-level — it understands layout structure, so a minor animation frame difference does not produce the same alert as a broken layout. Visual validation is part of the automated pipeline, not a separate manual review step that gets skipped under release pressure. 

 Automated tests across device configurations 

One of the biggest practical problems in cross-device automation is that a test written against one device’s element identifiers breaks on another device where the same element is identified differently.  

Qyrus’s self-healing engine detects when an element cannot be located using the original selector and finds the correct element based on contextual analysis — maintaining test stability across the device matrix without manual repair after each configuration-specific failure. 

Full matrix in parallel, fast enough for CI/CD 

Qyrus runs tests simultaneously across all devices in the coverage matrix. A test suite that would take hours to run sequentially across 30 devices completes in the time it takes to run on one. This makes comprehensive device coverage compatible with pull-request-level CI/CD — the full matrix is validated before merge, not only before a major release. 

 No-code test creation framework that works across every device 

Qyrus’s no-code recorder captures a user flow once and generates tests that execute across the full device matrix. There is no device-specific test authoring — the same test logic runs everywhere, with Qyrus handling device-specific element resolution automatically. Teams that do not have dedicated automation engineers can still run comprehensive cross-device suites. 

Final Thought 

Cross-device UX validation is not about covering more devices. It is about covering the right devices, testing the failure modes that actually reach production, and doing it in a way that fits into how your team ships software — not just before major launches when everyone is already under pressure. 

The teams that get this right are not the ones with the largest device labs. They are the ones who derive their coverage matrix from real user data, use emulators for what they are actually good at, test on real hardware for what emulators cannot replicate, and automate enough of it to make comprehensive cross-device coverage a normal part of every release cycle. 

See cross-device mobile testing with Qyrus 

Qyrus combines a real device cloud, AI-powered visual regression, self-healing automation, and parallel execution across your full device matrix — in a single platform. If your team is finding device-specific defects in production, or your device coverage is limited by what hardware you happen to have access to, Qyrus is built for exactly this. 

Request a demo to see how Qyrus validates cross-device UX on real hardware — before your users do. 

forester

FAQs 

How many devices is enough to test on? 

There is no universal answer — it depends on who your users are. Pull your analytics, identify the device and OS combinations that cover 80% of your active user base, and build a matrix around those. For most consumer apps that means 10–20 configurations across three hardware tiers. More important than the total is ensuring the matrix includes mid-range and budget hardware, not just the flagships that are easiest to access. 

We already use Chrome DevTools mobile emulation. Is that not enough? 

For layout and responsive design checks during development, it is a reasonable starting point. For UX validation before release, it is not. Chrome DevTools does not replicate manufacturer keyboard behaviour, real GPU rendering, touch input sensitivity, OS-level memory management, or performance on constrained hardware. Use it for development feedback. Use real devices for release validation. 

How do we handle dark mode testing without doubling our test suite? 

Dark mode does not require a separate parallel suite. Add a system-level dark mode toggle to the test setup configuration and run your existing visual regression suite in both states. The additional execution time is minimal. What it catches — hardcoded colours, broken transparent images, mixed-mode screens — is not minimal. 

What is the right way to test performance on a device we do not own? 

Cloud device farms with real device inventories are the standard solution. When evaluating a farm, specifically verify that their inventory includes the mid-range and budget hardware relevant to your user base — budget Android in particular is underrepresented in most farm inventories relative to its share of actual users. 

Should accessibility testing be part of cross-device testing or a separate workstream? 

Integrated, not separate. Accessibility failures are often device-specific: touch targets that meet guidelines on a high-density display fall below minimum size on a lower-density screen; font scaling at Large system size breaks layouts on specific devices; screen reader behaviour differs between VoiceOver and TalkBack. A single-device accessibility audit misses device-specific failures. Run accessibility checks as part of the cross-device matrix. 

Our team does not have automation engineers. Can we still do cross-device testing at scale? 

Yes — this is specifically what no-code mobile testing platforms address. Qyrus’s recorder captures user flows from a single session and generates tests that run across the full device matrix. You do not need to write device-specific test code. The platform handles element resolution and self-healing across configurations automatically. 

BFSI Mumbai, 2026

The future of banking, financial services, and insurance is being shaped by AI, automation, digital transformation, and resilient technology strategies. That’s why we’re excited to announce that Qyrus will be attending the BFSI Innovation & Technology Summit India—one of the region’s leading events bringing together technology and business leaders from across the BFSI sector to explore the next generation of innovation. 

We’re proud to share that Ameet Deshpande, SVP of Product Engineering at Qyrus, will be speaking during the event. 

Session Title: Coming Soon 

Drawing on years of experience helping global enterprises modernize software quality, Ameet will share insights into how AI-powered testing, intelligent automation, and autonomous quality engineering are helping financial institutions accelerate software delivery while maintaining the security, reliability, and compliance today’s industry demands. 

Whether you’re modernizing legacy systems, scaling digital banking initiatives, or exploring AI-driven quality engineering, this session will offer practical strategies for building faster, more resilient software delivery pipelines. 

Throughout the summit, our team will be available to discuss how Qyrus helps organizations transform software quality through intelligent, end-to-end testing across web, mobile, API, SAP, Salesforce, and enterprise applications. 

From AI-assisted test creation and autonomous execution to continuous quality insights, Qyrus enables teams to reduce risk, accelerate releases, and deliver exceptional digital experiences with confidence. 

If you’re attending the BFSI Innovation & Technology Summit India, we’d love to connect. Stop by, meet our team, attend Ameet’s session, and discover how modern quality engineering is helping financial institutions innovate with greater speed and confidence. 

We look forward to seeing you there! 

Qyrus Blog Featured Image thumbnail 2026-7

Capgemini’s World Quality Report has stated that 76% of enterprises directly link QA and test automation investments to business outcomes such as customer satisfaction and revenue protection. 

Why because every software release carries the same quiet risk. A change that was supposed to fix one thing breaks something else entirely.  

It happens across SMEs to big conglomerates, when you add a new feature with a shared module, a dependency update shifts expected behaviour, a configuration change has an effect nobody could have guessed. By the time you find it, it’s too late already. 

Regression automation is built to act as a safety net, helping organizations to test faster, release more frequently, and maintain quality when production capacity grows.  

Automated regression testing exists to catch those breaks before they reach your users. It runs on a defined set of checks against your application every time code changes, ensuring that what worked before still works now.  

So when it is built into your delivery pipeline, it transforms release quality from something you hope for into something you can practically use . 

Let’s explore what automated regression testing is, why it matters, how to build it properly, and what separates teams that do it well in the long and short term. 

What Is Automated Regression Testing? 

Automated regression testing is a continuous process, where a predetermined set of test cases check if existing software behaviour has not been unintentionally changed because of new code updates. 

Regression testing is the practice of re-running previously validated tests after a code change to confirm that existing functionality still behaves correctly. The word ‘regression’ refers to the direction of travel. 

Manual regression testing is a QA engineer working through a checklist by hand who can validate this, but only slowly and only once per cycle.  

Automated regression testing is an efficient way to replace that manual effort with scripts that execute the same checks consistently, in minutes, every time a developer pushes new updated code. 

The testing scope can range from individual unit tests that verify a single function, to end-to-end tests that can simulate a complete user journey across multiple systems.  

In practice, we have seen that a mature regression suite must include all levels. So that it can catch low-level logic errors quickly at the unit layer and confirm complete workflows at the integration and UI layers. 
 
Regression Testing vs. Other Test Types 

Test Type 

What It Verifies 

When It Runs 

Scope 

Regression Testing 

Existing functionality still works after a change 

Every code change, in CI/CD 

Broad — covers previously working features 

Smoke Testing 

Core application paths are operational 

Post-deployment, pre-full suite 

Narrow — critical paths only 

Sanity Testing 

A specific fix or feature works as expected 

After a targeted change 

Narrow — targeted area 

Exploratory Testing 

Undocumented or unexpected behaviour 

Manual, ad hoc 

Open-ended 

Performance Testing 

Speed, load, and scalability under stress 

Scheduled or pre-release 

Infrastructure and load profiles 


Why Release Quality Depends on Regression Automation 

The case for automating regression testing is not primarily about speed, though speed is a benefit. It is about coverage, consistency, and the compounding cost of finding defects late. 

What Happens When You Find Bugs Late 

Research from IBM Systems Sciences Institute showed that fixing a defect in production costs between 15 and 100 times more than catching it during development.  

Every layer of delay, from unit testing to integration testing, UAT, and production, increases the cost of remediation. Automated regression testing moves detection as early as possible in the cycle, which is why the practice is often described as shift-left testing. 

cost increase

What Happens Without Regression Automation 

Teams without automated regression testing face a predictable set of problems: 

  • Release cycles increase — manual regression before each release can take days or weeks, compressing the time available for development 
  • Coverage reduces under pressure — when deadlines are tight, manual testers deprioritise edge cases and secondary flows — exactly 4where regressions hide 
  • Confidence reduces — without objective evidence that existing features still work, release decisions become subjective and risk-averse 
  • Technical debt increases — undetected regressions reach production, require hotfixes, and generate incident reports that consume engineering capacity 

What Teams Gain When They Do It Well 

When automated regression testing is embedded correctly into the delivery process, the effects are practical and measurable: 

Faster release cycles — suites that previously took a week to run manually execute in under an hour in CI 

  • Finverse was able to cut regression time from 3 days to 1 hour, a 95% reduction, while maintaining stable releases across login, payments, and transfers. 
  • Infogainreported regression cycle time dropping from 40 hours to 4 hours with automated API and mobile testing integrated into CircleCI. 
  • UFT ROI case study reduced manual regression effort from 50 hours to 2.7 hours per cycle. 

Higher defect detection rates — consistent automated coverage finds issues that time-pressured manual runs miss 

  • REW Technologyreported a 40% increase in defect detection rate after implementing end-to-end automation and integrating tests into the pipeline. 
  • Nykaa said automation helped cut integration defects or production incidents by 90% while also expanding code coverage for critical services. 
  • The pattern is consistent: once teams automate high-risk flows and rerun them on every change, more regressions are found before release. 

Fewer production incidents — regressions are caught before they reach users, not after 

  • REW Technology reported a 30% decrease in production incidents after end-to-end automation. 
  • Finverse reported a 40% drop in production issues and zero blocking defects in key financial flows across four release cycles. 
  • Forsysreported more than 90% reduction in production functional defects after automating 90% of manual test cases. 

 Improved developer confidence — engineers can refactor and add features knowing the test suite will signal any breakage 

  • Bettermentsaid Datadog helped transform CI from a source of friction into a trusted system, driving build success rate up to 95% and letting developers focus more on shipping. 
  • Autolite QA Servicesdescribed a SaaS team that regained trust in automation after reducing flaky failures by 68% and cutting regression from 4–5 days to 1.5 days. 

 Reduced QA overhead —  Automation handles repetitive validation, freeing QA engineers to focus on higher-value exploratory and acceptance testing. 

  • Forsysreported 40% less manual work alongside a 50% reduction in test cycle time. 
  • The Eminence described manual regression dropping from 8–10 hours to 4 hours, allowing QA to spend more time on exploratory and edge-case testing. 
real world example

How to Build an Effective Automated Regression Suite 

A regression suite that is poorly built is often worse than no suite at all. It creates false confidence, slows CI pipelines with flaky tests, and takes more time to maintain than it saves. We have laid down the principles needed for effective regression automation that will help you to bring to a stage where your testing strategy works. 

  1. AlwaysStart with What Breaks Most Often 

The usual instinct when starting out is to automate the simplest paths — the standard user flows that work under normal conditions. These are the easiest tests to write but often the least valuable to automate, because they are also the least likely to regress. A regression is most dangerous in edge cases, integration points, and areas of the codebase that change frequently. 

Build your initial suite around: areas with the highest change frequency in version control, functionality that caused incidents or defects in the past twelve months, integration points between services or third-party dependencies, and any flow that handles money, authentication, or user data. 

  1. Structure Your Suite in Layers

Not every test should run at the same time or with the same frequency. A layered structure — often called a test pyramid, keeps fast feedback fast while still achieving broad coverage. 

end to end regression
  1. Direct Integrationinto Your CI/CD Pipeline 

A regression suite that runs only on demand provides lesser value as compared to one that runs automatically on every code change. So if you directly move with pipeline integration, it will trigger every pull request at the relevant test layers, and a failure can block the merge. This is the framework that makes regression testing a quality gateway rather than just a checkbox. 

The practical setup: unit regression tests run on every commit (under two minutes), integration tests run on every pull request (under fifteen minutes), and the full end-to-end suite runs nightly or on merge to the main branch. 

  1. Ensure toMaintain the Suite as Actively 

The most common reason regression suites fall apart is neglect. Tests that were accurate six months ago may now test behaviour that no longer exists, or miss behaviour that was introduced. A test suite that generates ten false failures per run will be disabled within a month. 

Assign ownership of the regression suite as explicitly as you assign ownership of the application. Set a policy for how quickly a failing test must be investigated — the answer should be hours, not days.  

At a low level we suggest to remove or rewrite tests that have been continuously flaky rather than suppressing them with workarounds. 

  1. Use AI-Powered Solutionsto Reduce Maintenance Overhead

One of the largest sources of regression test maintenance cost is UI change. Why? 
 
When an element on a page is renamed, moved, or replaced, every test that referenced the old element breaks — even if the underlying functionality is unchanged. Self-healing test automation uses AI to detect when a selector has changed and automatically update the test reference, without manual intervention. 

This is not a minor convenience. In applications with active front-end development, self-healing can reduce test maintenance time by 65–70%, turning what would be hours of manual test repair after each sprint into an automated background process. 

So the next big question you need to tackle is 
 

What Factors Your Regression Suite Should Cover 

The scope of a regression suite should be driven by risk, not convenience. These are the areas that belong in every production-grade regression suite 

Core User Flows 

The paths that define the purpose of your application — account creation, login, checkout, payment, core transactions — should be covered end-to-end in the regression suite. Any regression in these flows will be noticed by users immediately. 

API Contracts and Integration Points 

Regressions at the API layer are particularly dangerous because they are invisible to UI tests but affect every client that consumes the API.  

Your regression suite should validate that every API endpoint returns the expected status codes, response structure, and data types after each change.  

Contract testing — verifying that both the provider and consumer agree on the API shape is especially important in microservice architectures where teams deploy independently. 

Authentication and Authorisation 

Login flows, session handling, token expiry, and role-based access controls must be in the regression suite. Authentication regressions are among the most severe in terms of security impact, and they are often introduced by seemingly unrelated changes in the authentication middleware or session configuration. 

Data Validation and Boundary Conditions 

The rules that govern what data your application accepts — required fields, format constraints, length limits, numeric ranges — should be tested after every change. These rules are frequently affected by database schema changes, model updates, or third-party integration modifications. 

Cross-Browser and Cross-Device Compatibility 

For web applications, a change that renders correctly in Chrome may break in Safari or Firefox. For mobile applications, behaviour on Android may differ from iOS. Regression testing across the supported browser and device matrix should be part of the pre-release suite, particularly after front-end changes. 

Performance Baselines 

Response time regressions are as damaging as functional regressions. Include latency assertions for critical endpoints — if the p95 response time for your checkout API doubles after a change, that should fail the regression suite just as definitively as a broken status code. 

Common Mistakes That We Should Avoid in Regression Automation 

These are the patterns that cause regression suites to provide less value than expected or to be abandoned entirely. 

Treating the Suite as a One-Time Project 

Regression suites are living systems. An application that ships code every week has a test suite that needs to change every week. Teams that build the suite, declare it done, and stop actively maintaining it will find that test coverage drifts away from the actual application until the suite is more noise than signal. 

Automating the Wrong Tests 

Not every test should be automated. Tests that require human judgement — evaluating visual aesthetics, assessing the tone of content, validating a complex accessibility journey — are poor candidates for automation.  

Automating them produces brittle, expensive tests that break on every release. Focus automation effort on tests that are deterministic: given a specific input, the expected output is always the same. 

Ignoring Simple Tests 

A flaky test is one that sometimes passes and sometimes fails on the same code without any change. A small number of flaky tests can destroy trust in an entire suite — if ten percent of failures are noise, engineers learn to ignore failures entirely. Treat flaky tests as defects in the test suite. Investigate them, fix the root cause, and do not suppress them with automatic retries as a long-term solution. 

Running Everything Sequentially 

Most test frameworks default to sequential execution. Most regression test cases are independent — they do not share state, and their execution order does not affect their result. Running them sequentially is leaving performance on the table. Parallel execution consistently reduces suite duration by 60–75% with no change to the tests themselves and no additional infrastructure cost. 

Separate QA from Development 

When regression testing is owned entirely by a separate QA team that runs tests only after development is complete, the feedback loop is too long to be useful.  

Because by the time a regression is found, the developer who introduced it has moved to another feature and has to context-switch back. So introduce Shift-left practices where developers write and run regression tests as part of their own workflow — reduce that feedback loop from days to minutes. 

How Qyrus Makes Regression Automation Work  

The principles above describe what good regression automation looks like. Qyrus is the platform built to deliver it — across web, mobile, API, SAP, and data layers — without requiring teams to build and maintain a custom automation framework from scratch. 

AI-Powered Test Creation and Maintenance 

Qyrus eliminates the most time-intensive parts of regression automation. Its no-code test recorder captures user flows and converts them into executable test cases.  

Our AI-powered engine detects when application changes break existing test selectors and repairs them automatically — removing the manual maintenance that causes most regression suites to degrade over time. 

SEER: Autonomous Orchestration 

Every regression run in Qyrus is managed by SEER — an AI orchestration framework that Senses changes in the codebase, Evaluates their impact, Executes the relevant tests in parallel, and Reports results with actionable diagnostic information.  

This means the suite does not run blindly in its entirety on every change — it runs the tests that are relevant to what changed, reducing execution time without reducing coverage. 

Unified Coverage Across Every Layer 

Most regression tools cover one layer of the application. Qyrus covers all of them from a single platform: web UI testing with cross-browser support, mobile testing on real devices, API regression testing with contract validation, SAP system testing with AI-driven change impact analysis, and data testing to verify that database and pipeline changes do not corrupt downstream systems. 

Conclusion 

Automated regression testing is not a tool you buy or a process you implement once. It is a discipline — one that pays compounding returns when maintained well and quietly degrades when neglected. The teams that get the most value from it are the ones that treat the test suite as a product, invest in its quality and coverage continuously, and integrate it tightly into every stage of their delivery pipeline. 

The specific mechanics like which framework to use, how to structure the pyramid, how to handle simple tests — matter less than the commitment to making regression validation a normal, automatic part of how software ships.  

When it is, release quality stops being a matter of luck or manual effort and becomes something the pipeline enforces. 

 If you are ready to move beyond the maintenance trap and build an automated regression testing strategy that scales with your product, book a demo with the Qyrus team today and see our framework in action.  

Frequently Asked Questions 

 What is the difference between regression testing and retesting? 

Retesting verifies that a specific defect that was previously reported has been fixed. Regression testing is broader — it verifies that fixing that defect, or making any other change, has not broken something else in the process. Retesting is targeted; regression testing is protective. 

How often should an automated regression suite run? 

The short answer is: as often as code changes. For most teams, this means running a fast subset (unit and critical integration tests) on every commit, the full suite on every pull request, and an extended suite including performance checks nightly. The goal is that no regression survives for longer than one development cycle before being detected. 

Which tests should be included in a regression suite? 

Prioritise tests that cover core user flows, integration points between services, authentication and authorisation logic, data validation rules, and any area that has previously caused a production incident. Tests that are deterministic — where the expected output for a given input is always the same — are the best candidates for automation. 

How do you manage a regression suite as the application grows? 

Assign explicit ownership of the suite, set a policy for reviewing and retiring outdated tests, and invest in tooling that reduces maintenance overhead — particularly AI-powered self-healing for UI tests. The suite should be treated as a first-class software system with its own code review, version control, and quality standards. 

What is the role of shift-left testing in regression automation? 

Shift-left testing means moving regression checks earlier in the development cycle — to the point where developers run them locally before committing code, rather than waiting for a QA cycle after development is complete. This shortens the feedback loop from days to minutes, reduces the cost of fixing defects, and distributes quality responsibility across the entire team rather than concentrating it in QA. 

Can automated regression testing replace manual QA entirely? 

No. Automated regression testing handles deterministic, repeatable validation efficiently. It cannot replace the human judgement required for exploratory testing, accessibility evaluation, usability assessment, or subjective quality checks. The optimal model uses automation for what it does best and reserves manual QA effort for what requires human insight. 

How does AI change regression testing? 

AI introduces three meaningful changes: it reduces the effort required to create tests (through natural language or no-code recording), it reduces the effort required to maintain them (through self-healing that repairs broken selectors automatically), and it makes test selection smarter (by analysing code changes to determine which tests are most relevant to run, rather than running everything). These changes make regression automation accessible to teams that previously lacked the resources to sustain it. 

Featured Image

A five-second freeze is all it takes. Eighteen percent of users will uninstall an app on the spot after one bad freeze, and nearly a third abandon it within a month of installing it at all. For a QA team, that’s not an abstract quality metric, it’s the difference between a release that grows the business and one that quietly bleeds users before anyone notices. 

That’s why “what’s the best mobile test automation platform” is such a loaded question. The honest answer isn’t a single product name, it’s a framework for matching platform capabilities to the failure mode your team actually needs to prevent. This guide breaks down exactly that: a direct answer for common scenarios, the six criteria that separate serious platforms from the rest, and where each category of tool fits. 

What Is the Best Mobile Test Automation Platform? 

The best mobile test automation platform depends on three variables: your authoring model, how you execute against real devices, and how much of your maintenance burden AI can absorb. 

  • For open-source flexibility and full control: Appium remains the standard — it’s free, framework-agnostic, and covers native, hybrid, and mobile web apps across Android and iOS from a single codebase. 
  • For real-device execution and AI-driven maintenance in one platform: Qyrus combines a real Android/iOS Device Farm with AI-powered Mobile Testing, including Healer AI script correction and visual UI validation — Qyrus was named a Leader in The Forrester Wave™: Autonomous Testing Platforms, Q4 2025, scoring the maximum available rating in several evaluation criteria among 15 vendors assessed. 
  • For teams that need broad device-cloud breadth above all else: BrowserStack, Sauce Labs, and Perfecto offer some of the largest real-device libraries on the market. 
  • For teams already fully invested in AI-native, no-code authoring: newer AI-first platforms let non-developers describe tests in plain language, trading some low-level control for speed. 

None of these platforms is universally “the best”. The right one depends on which of the six criteria below matters most for your app and your team. 

Platform 

Best For 

Device Access 

AI Self-Healing 

Appium 

Open-source flexibility 

Emulator + real (via 3rd-party grid) 

No (native) 

BrowserStack / Sauce Labs / Perfecto 

Device-cloud breadth 

Real device cloud 

Varies by plan 

Qyrus 

Real-device + AI maintenance in one platform 

Real device cloud (Device Farm) 

Yes — Healer AI 

AI-native platforms 

No-code authoring speed 

Varies 

Yes 

Comparison Table

Why the Right Platform Choice Is a Revenue Decision 

Mobile quality problems aren’t cosmetic, they directly affect revenue. Seventy-one percent of app uninstalls are tied to crashes and bugs that thorough testing could have caught, and 94% of uninstalls happen within the first 30 days of install. Users are especially unforgiving of performance issues: an app that simply freezes for five seconds will lose 18% of the people who just installed it. 

Layer device fragmentation on top of that and the scale of the problem becomes clear. There are more than 24,000 distinct, active Android device models in circulation today, and six major Android versions — 11 through 16 — all still carry meaningful active-install share simultaneously. A platform that can’t run comprehensive test coverage efficiently across that spread isn’t just slower, it’s leaving coverage gaps exactly where users are most likely to hit a crash your team never saw. 

Stat Infographic

6 Criteria That Actually Separate Mobile Test Automation Platforms 

On paper, feature lists make every platform look similar. These six criteria are where they actually diverge.

6- Criteria Criteria
  1. Real device execution vs. emulators and simulators.Emulators are fine for early-stage checks, but theycan’t reliably replicate real network conditions, battery behavior, or biometric prompts. A platform’s real-device access, not its device count alone, is what determines whether your test results reflect what users actually experience. 
  2. AI-driven self-healing.Locator-based scripts break the moment a button shifts or a label changes text. Teams running unassisted Appium suites at scaleroutinely lose 60-70% of QA time to fixing broken selectors. An AI-driven testing process that heals broken locators automatically has become the difference between a test suite that stays useful and one your team quietly stops trusting. 
  3. Cross-platform testing coverage.A platform that requires separate test suites for Android and iOS doubles your maintenance load. Look for genuine single-codebase coverage that supports both Android and iOS from the same test cases, among the key features that matter most as your app portfolio grows.
  4. Device and OS fragmentation handling.Given 24,000+ Android models alone, no team can test everything. The best platforms support risk-based device pools rather than forcing an all-or-nothing device matrix.
  5. CI/CD-native integration.A mobile test automation platform thatdoesn’t trigger automatically on a pull request or build is a manual step waiting to be skipped. Native hooks into tools like Jenkins, Azure DevOps, and GitHub Actions are non-negotiable in 2026. 
  6. Parallel and scalable execution.Sequential test runsdon’t survive a fast release cadence. The platform needs to run suites across many devices simultaneously without the queue becoming the bottleneck, and reporting needs to keep pace — screenshots, video recordings, and device vitals (CPU, memory, network usage) captured per run, not just a single pass/fail flag at the end. 

Weigh these six against each other rather than treating them as a checklist to satisfy in full. A five-person startup team testing a single native Android app has a very different priority order than an enterprise team shipping cross-platform releases weekly across a dozen markets, and the platform that wins on paper for one context can be badly over- or under-built for the other. 

The Three Categories of Mobile Test Automation Platforms in 2026 

Rather than ranking twenty individual tools, it’s more useful to understand the three categories they fall into, because the category, not the brand name, determines the tradeoffs you’re accepting. 

Open-source frameworks — Appium, Espresso, XCUITest. Free, flexible, and backed by large communities, but the maintenance cost falls entirely on your team. Best for teams with strong in-house automation engineering. 

Real-device cloud platforms — BrowserStack, Sauce Labs, Perfecto, Qyrus Device Farm, and similar. These solve the device-fragmentation problem by giving you on-demand access to real hardware instead of maintaining an in-house device lab. Best for teams that need breadth and reliability without owning physical infrastructure. 

AI-native and self-healing platforms — a growing category where AI handles locator maintenance, and in some cases test authoring, automatically. Best for teams trying to escape the 60-70% maintenance tax that traditional scripted automation carries. 

Many mature platforms — Qyrus among them — now blend the second and third categories: real-device execution paired with AI-driven maintenance, rather than forcing a choice between the two. That combination matters because device access alone doesn’t solve test fragility, and AI-driven maintenance alone doesn’t solve device fragmentation — a team needs both working together to keep pace with a modern release cadence. 

The category distinction also changes how you should evaluate pricing and onboarding. Open-source frameworks carry no license cost but the highest engineering-hours cost. Device cloud platforms typically price by device-minutes or seats, which scales predictably with team size. AI-native platforms often price by test volume or usage credits, which rewards teams that consolidate suites rather than maintaining redundant coverage. Understanding which category you’re evaluating — before comparing brand names — makes the pricing conversation much clearer. For a broader comparison across web, mobile, and API no-code platforms specifically, see our related guide: Top No-Code Test Automation Tools for Web, Mobile, and API Testing 2026. 

How Qyrus Approaches Mobile Test Automation 

Qyrus’s mobile offering is built around two components working together: Mobile Testing for AI-driven test authoring and execution, and Device Farm for real-device access at scale. 

On the authoring side, Qyrus Mobile Testing simplifies test creation and test management with a live device connection for building and previewing tests against a real-time video stream, a mobile recorder that captures user actions as test steps, and Healer AI — which automatically finds new locators for failed steps when the UI changes, so tests don’t break every time a button moves. Visual testing catches UI regressions that functional assertions alone would miss, and Rover AI adds autonomous exploratory testing to surface issues scripted regression tests weren’t written to catch, all aimed at faster test execution without sacrificing coverage. For deeper context on how this fits into a broader agentic testing approach, see Beyond Linear Scripting: Why 2026 is the Year of Modular, Agentic Mobile Testing. 

On the infrastructure side, Qyrus Device Farm provides access to real Android and iOS devices — smartphones and tablets — backed by a 99.9% real device availability commitment, with support for Android 9+ and iOS 14+, plus day-one support for new OS releases. Teams can run manual sessions with full device control, simulate interrupts like incoming calls to test how an app recovers, configure network shaping to test under real-world conditions like a slow 3G connection, and use biometric bypass to streamline testing of authentication flows. The platform runs in an ISO 27001/SOC 2-compliant cloud environment, and Qyrus is the only vendor offering fully dedicated, private devices that teams can configure exactly as their end users would. More on why real-device coverage matters at scale: Struggling with Fragmentation Frustration in AI Era? Why You Still Need a Mobile Device Farm. 

 A London-based neobank illustrates the impact of this combination. With a small four-person manual testing team and a limited budget, the bank needed to scale mobile test coverage fast without adding headcount. Using Qyrus Mobile Testing and Device Farm on Android and iOS, the team reached 90% test coverage in 10 weeks, cut test build time by 50% through script cloning, and shipped with zero bugs leaked to production. Read the full case study. 

Frequently Asked Questions 

What is a mobile test automation platform? 

A mobile test automation platform is software that runs pre-written or AI-generated test scripts against a mobile app automatically, without a human manually tapping through each screen. It validates functionality, UI, and performance across devices and OS versions as part of a release pipeline. 

Is Appium still relevant in 2026? 

Yes. Appium remains the most widely used open-source mobile automation framework, supporting native, hybrid, and mobile web apps across Android and iOS from a single codebase. Its main tradeoff is maintenance: locator-based scripts require ongoing upkeep as the app’s UI changes, which is why many teams pair it with AI-assisted self-healing tools. 

What’s the difference between a device farm and an emulator? 

An emulator simulates a device in software, which is useful for quick early checks but can’t fully replicate real-world conditions like network variability, battery behavior, or biometric hardware. A device farm gives you on-demand access to actual physical devices, so test results reflect what real users experience. 

How much does AI self-healing actually reduce maintenance time? 

Teams running unassisted, locator-based automation at scale commonly lose 60-70% of QA time to fixing broken selectors after UI changes. AI-driven self-healing tools reduce that overhead significantly by automatically identifying updated locators when elements shift, though the exact reduction varies by platform and app complexity. 

Can one platform test both Android and iOS? 

Most modern mobile test automation platforms, including Appium and Qyrus Mobile Testing, support both Android and iOS from a single test suite, which avoids maintaining separate scripts per platform. 

What should a small QA team prioritize first? 

Real device access and AI-driven maintenance typically deliver the fastest return for small teams, since they directly reduce the two biggest cost centers in mobile QA: infrastructure overhead and script upkeep. Cross-platform, CI/CD-native platforms let a small team cover more ground without proportionally more headcount. 

Conclusion 

There’s no single “best” mobile test automation platform, there’s a best fit for your team’s authoring preferences, device coverage needs, and tolerance for maintenance overhead. What doesn’t change is the cost of getting it wrong: with 71% of uninstalls tied to preventable crashes and over 24,000 Android device models to account for, the platform decision is a revenue decision as much as a technical one. 

Qyrus approaches this with real-device execution through its Device Farm and AI-driven maintenance through Mobile Testing’s Healer AI and Rover AI, an approach that helped a London-based neobank reach 90% coverage in 10 weeks with zero production bugs leaked. Request a demo to see how Qyrus’s Mobile Testing and Device Farm can cut your team’s maintenance overhead and device-fragmentation risk.

Qyrus Blog Featured Image thumbnail 2026

Most test automation evaluations start with a feature checklist and end with a tool that looks great in the demo and buckles under real release pressure six months later. That gap isn’t a procurement failure. It’s a framework failure — enterprises are comparing the wrong things, at the wrong level, for the wrong reasons. 

Here’s the number that should redirect the conversation: QA teams that depend on manual or brittle automated processes spend 40% to 60% of their working hours on test maintenance, not on writing new tests or catching new bugs. That’s the maintenance trap, and it’s the single biggest hidden cost in any test automation decision — one that rarely shows up on the RFP scorecard. 

QA hours lost

The market is responding accordingly. The global test automation market is projected to grow from roughly $19.97 billion in 2025 to $51.36 billion by 2031. That growth isn’t speculative; it’s enterprises collectively admitting that scripted, manually-maintained automation can’t keep pace with modern release velocity. 

This guide isn’t a tool ranking. It’s a framework — seven criteria that separate platforms genuinely built for enterprise scale from tools that simply added an AI feature to an old architecture. If you’re specifically evaluating cloud/SaaS-only platforms, our guide to choosing SaaS test automation platforms goes deeper on that narrower decision. This piece is for the broader enterprise buy: web, mobile, API, desktop, and the legacy systems that don’t fit neatly into a SaaS-only evaluation. 

Two tool categories

Why Most Evaluations Compare the Wrong Things 

The most common mistake enterprise buyers make is putting fundamentally different categories of tool side-by-side on the same scorecard. A scripted open-source framework and an AI-native enterprise platform both get called “test automation tools,” but they solve different problems for different teams. Comparing them on a feature-by-feature basis treats a skill-level and architecture decision as if it were a simple feature decision. 

Before you build an evaluation matrix, get clear on which category you’re actually shopping in: 

  • Developer-led scripted frameworks (Playwright, Selenium, Cypress, Appium) — free, flexible, and require engineering capacity for ongoing maintenance as the suite grows. 
  • AI-native, codeless enterprise platforms — built for QA teams who need to scale automation across surfaces without a dedicated automation-engineering bench for each one. 
  • Point solutions (visual testing only, performance testing only, mobile-device-farm only) — excellent at one job, but they add integration overhead if your enterprise needs unified reporting across surfaces. 

Once you know which category fits your team’s skills and scale needs, the seven criteria below tell you how to evaluate within it. 

1. Breadth Across Surfaces Without Framework-Switching 

Enterprises rarely test just one thing. A single customer journey might touch a web front end, a mobile app, three backend APIs, and a legacy desktop or SAP screen. If your test automation platform only covers one of those surfaces, you’re stitching together multiple tools, multiple reporting formats, and multiple places where a defect can hide between the seams. 

What to evaluate: 

  • Does the platform natively support Web, Mobile (native and hybrid), API, and Desktop testing — or does “support” mean a separate product with a separate login and separate reporting? 
  • Can a single test flow chain steps across surfaces (e.g., start a transaction on web, verify it on mobile, confirm the backend state via API) without manually re-platforming the test logic? 
  • If your enterprise runs SAP, Salesforce, or another packaged ERP/CRM, does the platform have purpose-built support for that system’s dynamic, frequently-changing UI — or is it relying on generic web locators that break on every patch? 

A unified platform doesn’t just save licensing costs. It removes the reporting fragmentation that makes “are we covered end-to-end?” an unanswerable question during a release retro. 

2. Maintenance Architecture, Not a Self-Healing Checkbox 

Almost every vendor now claims “self-healing.” Almost none of them explain how it actually works, and the difference matters enormously for total cost of ownership. The architectural distinction industry analysts are increasingly drawing is between platforms that are AI-native from the ground up and platforms that added an AI layer on top of a traditional scripted framework — the latter produces marginal maintenance reduction, not structural reduction. 

Questions that separate real self-healing from marketing self-healing: 

  • What does it heal against? Effective self-healing references a previous passing execution — a baseline — and suggests corrected locators (ID, class, XPath) when the application changes. If a vendor can’t explain their reference mechanism, ask them to. 
  • Does it require a clean baseline first? Most legitimate self-healing tools need at least one successful, non-dry-run execution to heal against later. If a platform claims to heal scripts with no prior passing run, be skeptical of how that’s actually working. 
  • What’s the maintenance number it actually moves? Don’t accept “reduces maintenance” as an answer. Ask for a percentage, and ask whether that number comes from a third-party study (like a Forrester Total Economic Impact report) or an internal benchmark. 

This is the single highest-leverage criterion on this list. A platform that gets self-healing right structurally changes the economics of test maintenance — described elsewhere as the QA “janitorial work” that consumes senior engineers’ time without adding new coverage. A platform that gets it wrong just defers the maintenance bill. 
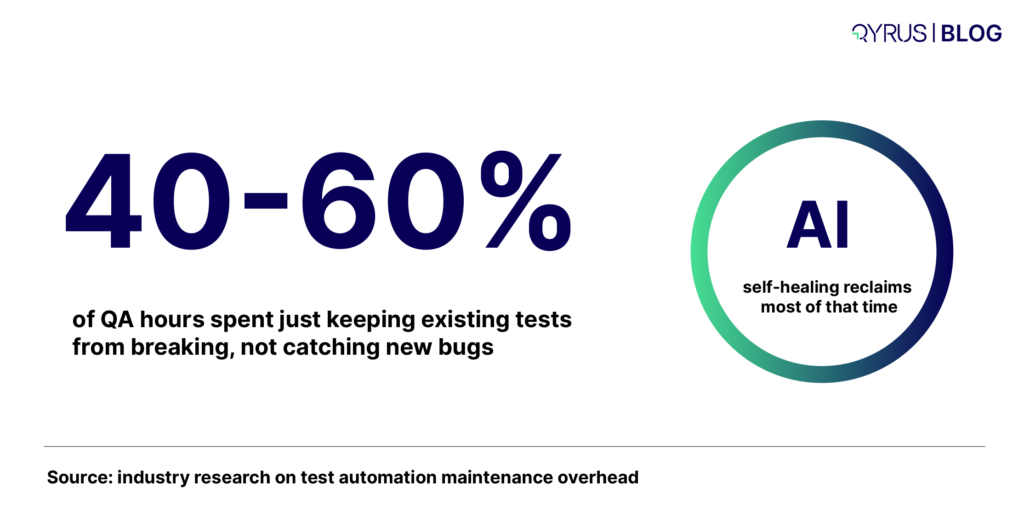
For a deeper technical breakdown of how self-healing mechanisms actually work — and which architectural patterns hold up at scale — see our complete guide to self-healing test automation. 

3. Genuine AI Test Generation, Not AI-Flavored Scripting 

“AI-powered” has become a checkbox term. The real question is whether the platform’s AI understands intent — what the test is supposed to verify — or whether it’s simply converting recorded clicks into code with a generative wrapper around the UI. 

Evaluate AI test generation on: 

  • Input flexibility. Can it generate test scenarios from a plain-language description, a Jira ticket, or a requirements document — or only from a recorded session? 
  • Context awareness. Does it understand existing test coverage well enough to suggest new scenarios that fill genuine gaps, rather than generating redundant tests that inflate your suite without adding confidence? 
  • Criticality scoring. Enterprise-grade generation tools don’t just produce volume; they categorize generated scenarios by risk or criticality, so your team can prioritize execution under time pressure. 
  • Explainability. Can a reviewer see why the AI generated a given test step, or is it a black box you either trust completely or discard? 

This is also where the broader industry conversation is moving from automation toward orchestration — AI agents that don’t just execute predefined scripts, but determine what to test, generate the relevant cases, and reason about results. If you’re evaluating platforms on a multi-year horizon, ask vendors directly where they sit on that spectrum today, and where their roadmap is headed. 

4. Execution Scale and Real-World Infrastructure 

A test that passes in a sandboxed local environment and a test that passes across the actual matrix of browsers, devices, and network conditions your customers use are not the same test. Enterprise-grade execution infrastructure is what closes that gap. 

What to look for: 

  • Parallel execution at meaningful scale. Can the platform run hundreds of tests simultaneously across a browser and device farm, or does scale require provisioning your own infrastructure? 
  • Real devices, not just emulators. Emulators miss hardware-specific behavior — battery drain, memory pressure, real network handoffs. A platform with access to real Android and iOS devices, including day-one support for new OS releases, catches issues emulator-only testing misses entirely. 
  • Network condition simulation. Can you test how the application behaves on throttled 3G or high-latency connections, not just on your office Wi-Fi? 
  • Compliance posture of the infrastructure itself. ISO 27001 and SOC 2 Type 2 compliance on the browser/device farm isn’t a nice-to-have for regulated industries — it’s frequently a procurement gate. 

5. CI/CD and Ecosystem Depth — Not Just a Logo Wall 

Every vendor’s integrations page has a wall of logos. The real evaluation question is whether those integrations are bi-directional and operationally deep, or whether they’re a one-way trigger that doesn’t feed results back into the tools your team actually lives in. 

Dig into: 

  • Test management traceability. Can the platform link automated scripts to Jira, Xray, or TestRail issues and update them automatically with execution results — or does someone have to manually copy-paste outcomes? 
  • CI/CD trigger depth. Does a code push or pull-request merge automatically trigger the right subset of tests, or does someone have to manually kick off a run? 
  • Granular feedback, not just pass/fail. The platforms that meaningfully speed up release cycles deliver step-level data, screenshots, and logs back into the pipeline — not just a green or red status check. 
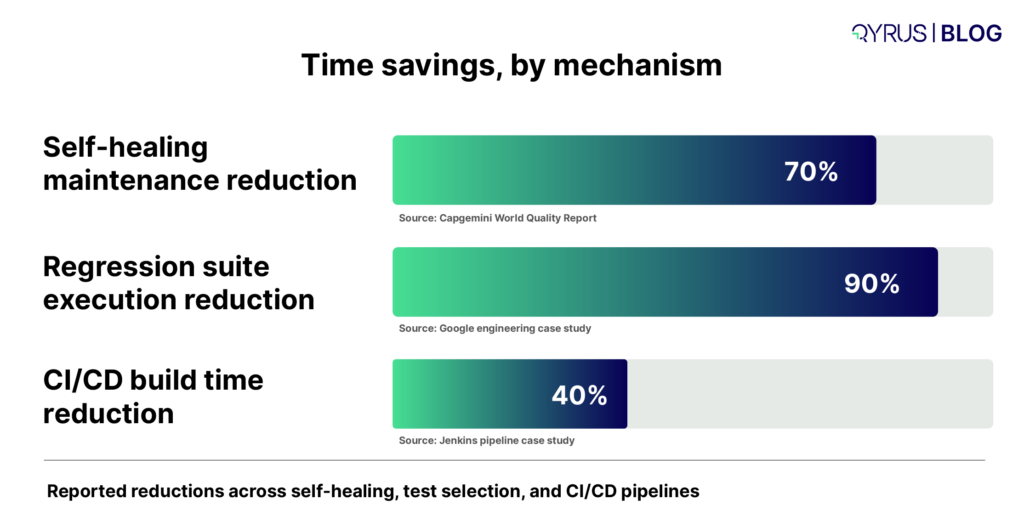
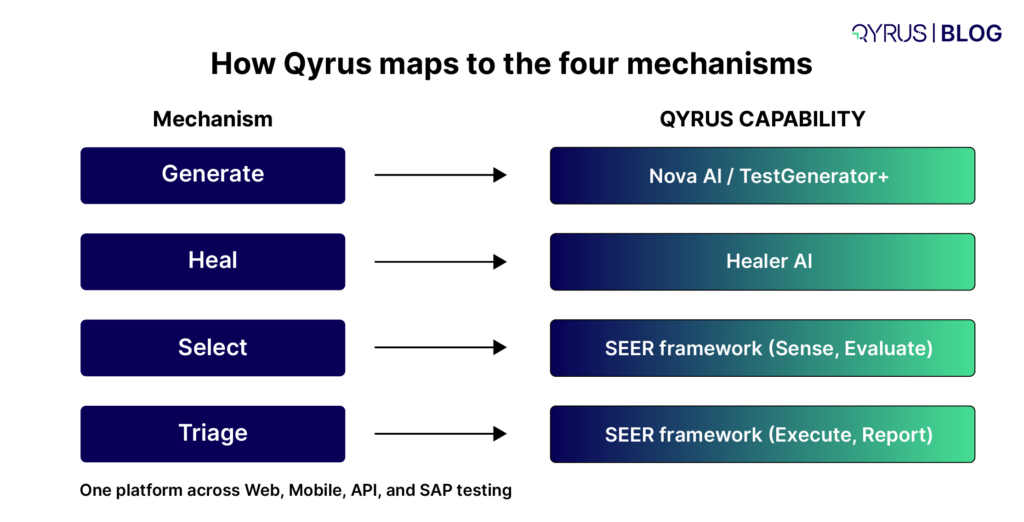
  • Notification routing. Can failures route to the right channel (Slack, Teams, email) with enough context that someone can act without opening five tabs to reconstruct what happened? 

Survey data from 2026 consistently shows that depth of DevOps pipeline integration is one of the clearest separators between high- and low-performing automation programs — teams with tight integration report faster cycles and lower defect leakage than teams running automation as a side process. 

6. Governance, Security, and Enterprise Readiness 

Features that look optional in a pilot become non-negotiable the moment a platform touches production data, regulated workflows, or a security review. This is the criterion most often skipped in early-stage evaluations and most often the reason a deal stalls in procurement six weeks later. 

Confirm before you’re deep into a contract: 

  • Compliance certifications — ISO 27001, SOC 2 Type 2, and any industry-specific requirements (PCI-DSS for payments, HIPAA-adjacent controls for healthcare-adjacent data). 
  • Access control granularity — role-based permissions (Admin, Editor, Viewer, Contributor) at the project level, not just account-wide admin/non-admin toggles. 
  • Secrets handling — are credentials and API keys encrypted and excluded from logs and reports by default, or does someone have to remember to mask them manually? 
  • Audit trail — can you reconstruct who changed what test, when, and why, months after the fact. 

None of this shows up in a demo. All of it shows up in a security questionnaire, and a platform that can’t answer cleanly will cost you months of procurement delay regardless of how good its automation capabilities are. 

7. Total Cost of Ownership, Not License Price 

The license quote is the most visible number in any evaluation and frequently the least important one. The real cost structure includes build effort, ongoing maintenance, infrastructure, and the engineering time spent operating the framework — and that maintenance line item compounds in ways that are easy to underestimate at signing. 

license price

A useful mental model: model three numbers, not one. 

  1. Build cost — engineer-time to stand up initial coverage, whether that’s scripting against an open-source framework or configuring a codeless platform. 
  2. Annual maintenance cost — typically modeled as a percentage of build cost (commonly cited in the 15–30% range for healthier programs, and meaningfully higher for brittle, script-heavy suites). 
  3. Infrastructure and tooling cost — license fees, CI/CD compute, device/browser farm access, whether self-hosted or vendor-provided. 

The platforms worth paying a license premium for are the ones that demonstrably bend that maintenance curve downward — because year two and year three are where build-vs-buy math actually gets decided, not year one. For the full model on running these numbers yourself, our guide to software testing cost estimation and strategic reduction walks through the calculation in detail. And if your current bottleneck is specifically about scaling an existing program rather than starting fresh, these 10 bottlenecks that block scaling test automation are worth checking against your own roadmap before you sign anything new. 

The Enterprise Evaluation Checklist 

Seven criteria

Use this as a working scorecard during vendor conversations: 

  • Covers Web, Mobile, API, and Desktop from one platform with unified reporting 
  • Self-healing references a verified baseline and the vendor can explain the mechanism 
  • AI test generation accepts plain-language input and scores scenarios by criticality 
  • Real device farm with day-one support for new OS releases, not emulator-only 
  • Network condition simulation for realistic mobile/web performance testing 
  • Bi-directional integration with your test management tool (Jira/Xray/TestRail) 
  • CI/CD triggers run automatically on commit or PR merge, not manually 
  • ISO 27001 / SOC 2 Type 2 certified infrastructure 
  • Role-based access control at the project level 
  • Vendor can show a third-party-verified ROI/TCO study, not just an internal claim 

If a vendor can’t give you a confident, specific answer on more than two or three of these, that’s a data point — not a dealbreaker on its own, but a reason to ask harder follow-up questions before you sign. 

Where Do We Fit 

Qyrus is built around the seven criteria above rather than around any single one of them. The platform unifies Web, Mobile, API, Desktop, Data, and SAP testing in one environment, so enterprises validating end-to-end business processes aren’t reconciling reports across five tools.  

Its Healer AI references a successful baseline script to suggest corrected locators when an application changes, and its TestGenerator and TestGenerator+ services generate and expand test coverage from Jira tickets or plain-language descriptions, with scenarios categorized by criticality. Execution runs across a browser and device farm with real Android and iOS hardware, day-one support for new OS releases, and ISO 27001/SOC 2 Type 2 compliance built into the infrastructure layer. 

On the cost side, a Forrester Total Economic Impact study found a 213% ROI with a payback period of under 6 months for organizations using Qyrus, alongside a 70% reduction in test-building time. None of that replaces doing your own evaluation against the framework above — but it’s the kind of third-party-verified number this guide suggests you ask every vendor for. 

Conclusion 

The platforms that hold up under real enterprise pressure aren’t the ones with the longest feature list. They’re the ones whose architecture was built to bend the maintenance curve down, scale execution across the surfaces your business actually runs on, and survive a security review without scrambling. Run any platform you’re evaluating through the seven criteria here, and you’ll know within a few conversations whether you’re looking at an enterprise-grade platform or a well-marketed script. 

FAQ 

What’s the difference between a test automation framework and a test automation platform? 

A framework (like Selenium, Playwright, or Appium) is a library that developers use to write and run test scripts — it’s free, flexible, and requires engineering effort to build and maintain. A platform is a more complete product that typically adds codeless test creation, AI-driven maintenance, execution infrastructure, and reporting on top of (or instead of) a scripting layer, aimed at QA teams who need to scale automation without a large dedicated engineering bench. 

How much does an enterprise test automation platform cost? 

Enterprise platform pricing is typically customized and quote-based rather than published, but the total cost of ownership includes more than the license fee: build effort, annual maintenance (commonly modeled as 15–30% of build cost for well-maintained programs), and infrastructure such as device farms and CI/CD compute. Comparing license price alone without modeling maintenance cost is the most common evaluation mistake. 

Is open-source or a commercial platform better for enterprises? 

It depends on team composition and scale, not on which option is objectively “better.” Open-source frameworks cost nothing in licensing but require dedicated automation engineers to build and maintain coverage as the application changes. Commercial AI-native platforms cost more upfront but are designed to reduce the ongoing maintenance burden, which often becomes the larger cost driver once a test suite reaches enterprise scale. 

What is self-healing test automation and does it actually work? 

Self-healing automation automatically detects when a UI element’s locator has changed and suggests or applies an updated locator, rather than requiring a human to manually fix the broken script. It works reliably when it references a previous successful execution as a baseline; vendors that can’t explain their reference mechanism should be evaluated cautiously. 

Should enterprises evaluate SaaS-specific test automation platforms differently from general enterprise platforms? 

Yes — SaaS-only platforms typically optimize for cloud-native applications and may not natively support legacy desktop, on-premise ERP, or mainframe systems that many enterprises still run. If your testing scope includes legacy or packaged-application surfaces alongside cloud applications, evaluate against the full criteria here rather than a SaaS-specific checklist alone. 

Featured Image-AI Test Automation

Most QA teams already know the uncomfortable truth about test automation: building the suite was never the hard part. Keeping it alive is. When people do research on taking care of test automation they always find that QA teams who use scripted frameworks spend 40 to 60 percent of their working hours just keeping existing tests from breaking, not writing new ones, not catching new bugs, simply patching selectors that broke because a button got renamed.  This is the problem that AI test automation was made to fix. It is an idea to understand how AI test automation works, rather than just believing what people say. 

This isn’t a single feature. AI test automation reduces testing time through four distinct mechanisms working together: faster test creation, self-healing scripts that survive UI changes, smarter test selection that skips irrelevant runs, and automated triage that tells you which failures actually matter. Each one of these things helps with a part of the testing problem. If people understand all four they can pick a tool that really helps them than picking one that just gives them another thing to check. 

self-healing reclaims

What Is AI Test Automation? 

AI test automation applies machine learning and natural language processing to the parts of testing that have historically required the most manual, repetitive human effort. This includes writing test scripts keeping them up to date when the application changes, deciding which tests to run and figuring out what a failure means. It works with the underlying system that runs your tests across browsers, devices and APIs. It does not replace it. 

Traditional automation frameworks like Selenium, Cypress, and Playwright are still doing the work of executing scripted steps. What has changed is everything around that execution. Traditional scripts use fixed selectors, like a CSS class or a hardcoded XPath, that stop working when a developer renames a button, but AI-driven frameworks can recognize the element in different ways and keep working even when the underlying code changes. Traditional test creation meant a QA engineer had to write every assertion by hand, but AI can create a working test from a description or a Jira ticket in just a few minutes. 

The market reflects how mainstream this shift has become. The automation testing market reached an estimated $40.44 billion in 2026 and is projected to climb past $78 billion by 2031 This is because big companies are using AI tooling that creates self-healing scripts quickly. AI test automation is not an idea anymore. It is now a part of testing.  


Traditional Test Automation 

AI Test Automation 

Test creation 

Manual scripting, line by line 

Natural language or requirement-based generation 

Maintenance 

Manual fix every time the UI changes 

Self-healing locators adapt automatically 

Test selection 

Run the full regression suite every time 

Risk-based selection runs only affected tests 

Failure analysis 

Manual log review to find root cause 

Automated clustering and root-cause suggestions 


The Four Mechanisms That Actually Cut Testing Time 

The four mechanisms

If you only take one thing from this article, take this: when someone says “AI makes testing faster,” ask them which of these four mechanisms they mean. The answer changes what you should evaluate in a tool. 

Automated Test Case Generation 

The most visible time saving happens before a single test ever runs. AI tools can create test cases directly from structured inputs like Jira tickets, user stories, or plain-English descriptions, often within minutes, cutting test creation time that used to take hours or days down to a fraction of that. Some platforms report generating tests 10 times faster through natural language test creation, even for complex scenarios involving dynamic content or multi-step workflows. 

This matters because test creation has historically been the gatekeeping skill in QA. If only your most technical engineers can write a Selenium script, your test coverage is capped by how many of those engineers you have. Generation that works from natural language descriptions opens test creation to product managers, business analysts, and less code-fluent testers, which doesn’t just save time, it removes a structural bottleneck on coverage itself. 

Self-Healing Scripts 

This is the mechanism that saves the time and we have the numbers to prove it. It helps with the maintenance tax that we talked about earlier which’s around 40 to 60 percent. The way it works is that self-healing automation looks for lots of ways to find the thing on a website, like an ID or a class or where it is on the page or what it says. So when someone makes a change to one of those things the test does not stop working. It just finds the thing another way. Keeps going. This is because self-healing automation is really good at finding things in ways like if it cannot find something by its ID it will try to find it by its class or by where it is, on the page. Self-healing automation is very helpful because it saves time and makes sure that the test keeps running without any problems. 

The reported impact is substantial. Capgemini’s World Quality Report found self-healing reduces maintenance effort by up to 70 percent. One case study involving a major bank’s QA team went even further, reporting a 95 percent reduction in script maintenance and twice as fast regression cycles after adopting AI-driven locator matching. The mechanism is simple, but the compounding effect on a team’s calendar is not: hours that used to go to script repair go back into actual test design and exploratory testing. 

Risk-Based Test Selection 

Running an entire regression suite on every code change is the brute-force default, and it’s increasingly unnecessary. AI-driven impact analysis looks at what actually changed in a commit, cross-references that against historical defect data and dependency graphs, and runs only the tests that change could plausibly affect. 

The scale of the time savings here can be dramatic. Google has reported using this approach to cut test suite execution by roughly 90 percent while maintaining the same defect detection rate, by training a model to learn which tests were likely to fail based on the code changes in a given commit. At a more typical enterprise scale, organizations report reducing regression suite size by 30 to 40 percent while maintaining full coverage, and Fujitsu specifically reported a 35 percent reduction in QA labor hours after switching from manual test scoping to automated change impact analysis. None of these examples require Google-scale infrastructure. They require a model trained on the test history a team already has. 

Automated Failure Triage 

The last mile of the testing cycle is often the most manually intensive. Someone has to check if its a real bug, a test that sometimes fails or just an environment issue. AI-driven failure analysis clusters similar failures, flags likely root causes, and surfaces the handful of failures that actually need a human look, instead of leaving an engineer to wade through logs one at a time. 

The compounding effect of this on CI/CD pipelines is significant on its own. AI-powered test prioritization can get developers critical feedback on a code change within minutes of committing, rather than waiting hours for a full pipeline run. One documented case using AI-driven test prioritization in a Jenkins pipeline reported a 40 percent reduction in overall build times, by dynamically reordering and executing only the most impactful test cases based on historical results and code dependencies. Faster feedback doesn’t just feel better, it changes how often a team is willing to commit and test, which compounds release velocity over time. 

Time savings, by mechanism

Test Coverage and Quality Gains Beyond Speed 

Speed is the headline benefit, but it’s worth being clear that AI test automation’s value isn’t only about doing the same testing faster. It’s also about testing more thoroughly than manual processes ever could, without a proportional increase in headcount. 

AI-assisted generation tends to surface edge cases and boundary conditions that human testers, working under deadline pressure, are statistically more likely to skip. A test suite built primarily by hand tends to cluster around the “happy path,” the scenarios the team already expects to test, while AI-suggested scenarios can probe invalid inputs, unusual sequences, and combinations a human wouldn’t think to script. The net effect for most teams isn’t just a shorter testing cycle, it’s a wider net catching more of the defects that would otherwise reach production. That combination, faster and broader, is what separates a meaningful AI test automation strategy from a tool that just runs old scripts marginally quicker. 

The Limits of AI Test Automation (What It Can’t Do Yet) 

It would be dishonest to present AI test automation as a fully autonomous replacement for QA judgment, and most credible voices in the space don’t claim otherwise. AI test automation tools are genuinely good at the repetitive, pattern-recognition-heavy parts of testing. They are not yet good at understanding business logic, which is the part that determines whether a test is actually testing the right thing. 

AI-generated tests can overlook scenarios that matter specifically because of how your business operates, not how your UI is built; an AI model doesn’t inherently know that a particular discount code combination should never be allowed, even if nothing in the interface prevents it. Decision-making inside AI testing tools can also be opaque, meaning a tool might skip or deprioritize a test without an obvious, auditable reason, which is exactly the kind of gap a tester needs to catch. And large language models used for test generation can produce confidently wrong outputs, hallucinated assertions, plausible-looking but incorrect expected results, if a human isn’t reviewing them. 

None of this is an argument against adopting AI test automation. It’s an argument for treating it the way the field’s own research suggests: a force multiplier for QA judgment, not a substitute for it. Teams that get the most value tend to start with a clear pain point, a maintenance backlog, a slow regression cycle, a coverage gap, and apply AI deliberately to that problem, with human review built into the loop, rather than handing over an entire testing strategy and hoping the AI fills the gaps on its own. 

How Qyrus Helps Teams Cut Testing Time Across the Board 

Most AI testing tools solve one piece of this puzzle. Qyrus is built to address all four mechanisms in a single platform, and across more testing surfaces than most point solutions ever touch. 

On generation, Qyrus’s Nova AI builds functional test scenarios directly from a free-text description or a Jira ticket, while TestGenerator+ analyzes your existing scripts and proposes additional scenarios to close coverage gaps automatically, categorized by criticality so your team knows what to prioritize first. For a deeper look at how generation works under the hood, see our guide to generative AI for testing. 

Qyrus maps to the four

On maintenance, Healer AI references a successful baseline script and automatically suggests updated locators when an element’s ID, class, or XPath changes, the same self-healing mechanism behind the maintenance-reduction data above, applied across Qyrus’s Web, Mobile, and SAP testing services rather than confined to a single surface. We cover this mechanism in detail in our complete guide to self-healing test automation, including how it differs across implementation approaches. 

On test selection and orchestration, Qyrus’s SEER framework (Sense, Evaluate, Execute, Report) runs as a continuous loop: it senses changes via webhooks and API polling from sources like GitHub and Jira, evaluates impact through specialized Thinking Agents that trace dependency graphs and map design changes to test scenarios, executes only the tests that matter through a coordinated squad of agents like TestPilot and API Builder, and reports results back into a Context DB that makes the next cycle smarter. This kind of orchestration is also what separates a true AI test automation strategy from simply bolting AI onto an existing manual process, a distinction we explore further in our overview of scaling bottlenecks in test automation. 

And because Qyrus unifies Web, Mobile, API, and SAP testing on one platform instead of stitching together separate point tools for each surface, the time savings compound across an entire business process rather than staying siloed to a single UI layer, which is precisely the kind of end-to-end coverage most single-purpose no-code test automation tools can’t offer on their own. For a broader architectural view of how AI is reshaping the discipline as a whole, see AI in testing: architecting the future of software QA. 

The result, as with the Coca-Cola Bottler implementation that cut SAP test execution time by 88 percent (from 10,020 minutes down to 1,186 minutes across 500-plus automated scripts), isn’t just isolated time savings on individual test runs. It’s a measurably faster path from code commit to confident release. 

Frequently Asked Questions 

How does AI-powered test automation reduce testing time? 

AI test automation reduces testing time through four mechanisms: generating test cases from natural language or requirements in minutes instead of hours, self-healing scripts that adapt to UI changes without manual fixes, risk-based test selection that runs only the tests affected by a given change, and automated failure triage that clusters and prioritizes results so engineers aren’t manually combing through logs. Documented results range from a 70 percent reduction in maintenance effort to a 90 percent reduction in regression suite execution time, depending on which mechanism is applied. 

Will AI test automation replace QA engineers? 

No. AI handles the repetitive, pattern-based work, generating routine test cases, fixing broken locators, and surfacing likely root causes, but it doesn’t understand business logic or judge which edge cases matter most to your users. QA engineers remain essential for defining what to test, validating AI-generated results, and applying judgment AI doesn’t have. 

Is AI test automation ready for production use today? 

For specific, well-scoped use cases like self-healing UI tests, AI-generated regression suites, and risk-based test prioritization, yes, these are already running in production CI/CD pipelines at scale. Fully autonomous testing with zero human oversight is less mature and still requires careful validation before relying on it for critical releases. 

How is AI test automation different from traditional test automation? 

Traditional automation (Selenium, Cypress, Playwright) executes pre-written scripts using fixed selectors that break when the UI changes. AI test automation adds a layer on top: it generates tests from plain language, heals broken locators automatically, decides which tests to run based on what actually changed, and helps triage failures, all without requiring a human to manually rewrite scripts every release. 

Do AI test automation tools work with frameworks like Selenium or Playwright? 

Many AI testing platforms integrate with or build on top of existing open-source frameworks rather than replacing them outright, though the depth of that integration varies significantly by vendor. Some generate native framework code you own and can export; others run on a proprietary execution engine. It’s worth confirming this directly with any vendor before committing, since migration cost differs significantly between the two approaches. 

How do I get started with AI test automation? 

Start by identifying your actual bottleneck, whether that’s maintenance overhead, slow regression cycles, or limited coverage, rather than adopting AI broadly across your entire testing strategy at once. Pilot one mechanism (self-healing tends to show the fastest measurable return) against a real test suite, validate the results with your team, and expand from there. 

Conclusion 

AI test automation isn’t a single trick that makes testing faster. It’s four compounding mechanisms, faster test creation, self-healing maintenance, smarter test selection, and automated triage, each removing a distinct source of wasted time from the testing cycle. Together, they’re why organizations report cutting maintenance overhead by up to 70 percent and regression cycles by as much as 90 percent, without sacrificing coverage. 

Qyrus brings all four mechanisms together across Web, Mobile, API, and SAP testing on a single platform, so the time savings compound across your entire testing process instead of staying locked inside one tool for one surface. If you’re ready to see what that looks like against your own test suite, request a demo and find out how much time you could get back.