
Welcome to the July release!
This month, our engineering teams focused on advancing our AI capabilities, streamlining enterprise collaboration, and fortifying foundational performance across every corner of the platform.
As testing pipelines scale and applications become more dynamic, efficiency and visibility are paramount. In Web Testing, we are putting you in complete control of your AI workflows with a new Two-Stage Test Generation pipeline that previews scenarios before building code—slashing latency and saving tokens. We’re also embedding continuous quality assurance directly into your suites with the new AI-powered LLM Evaluator Service, while solidifying modular architecture with permanent Function Step Reference Linking and centralized integration security.
In API Testing, we are bridging the gap between quality engineering and generative AI by introducing a dedicated RAG Evaluation Test Type. This feature empowers you to validate LLM faithfulness, relevance, and citation precision natively alongside your standard REST suites. We have also overhauled large-scale workspace management with high-performance asynchronous cloning jobs to ensure smooth, uninterrupted UI performance.
Our cross-platform execution engines have received major usability upgrades as well. Desktop Testing now automatically detects and flags parameterized scripts, while Test Orchestration gains comprehensive loop rendering for desktop workflows. Collaboration and resource management are smoother than ever: Device Farm introduces team-based hardware filtering and hardened AI session stability, and Test Orchestration brings you one-click Report Deep Linking, integrated Jira defect creation, and real-time device and browser availability indicators right in your run configurations.
Let’s dive into the full breakdown of everything new across the platform this July!
Web Testing
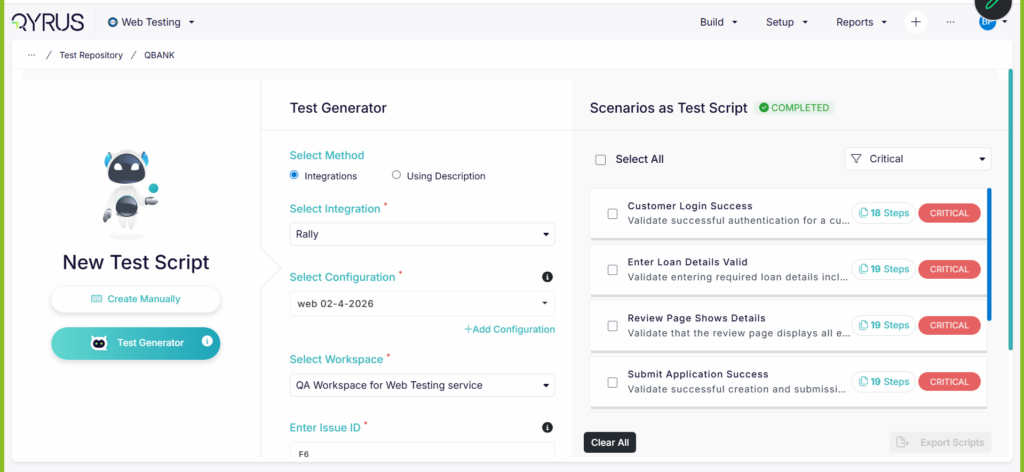
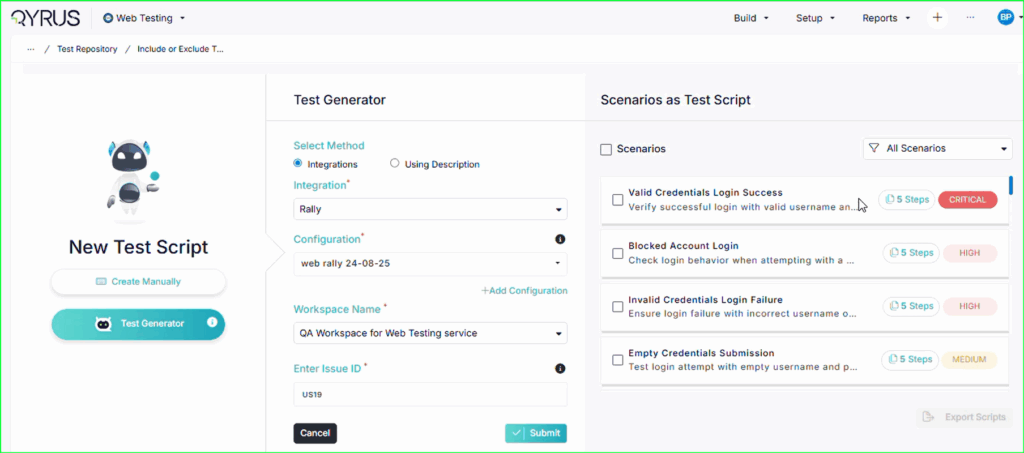
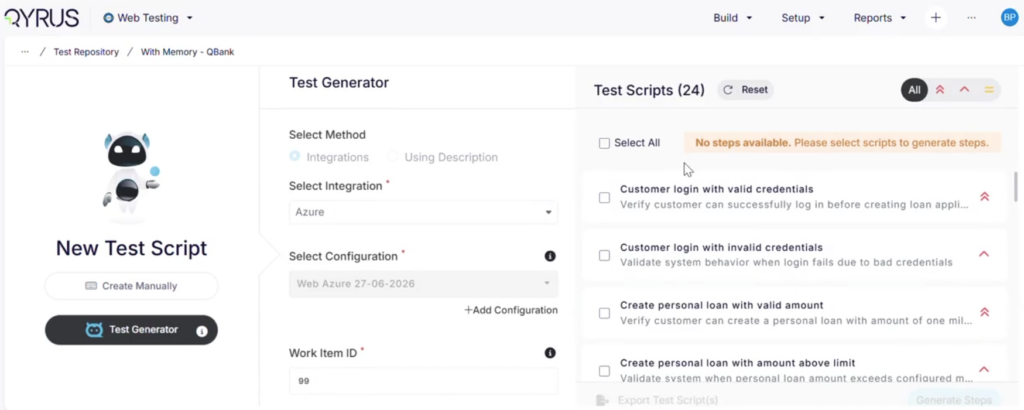
Smart Optimization: Two-Stage Test Generation!
The Challenge:
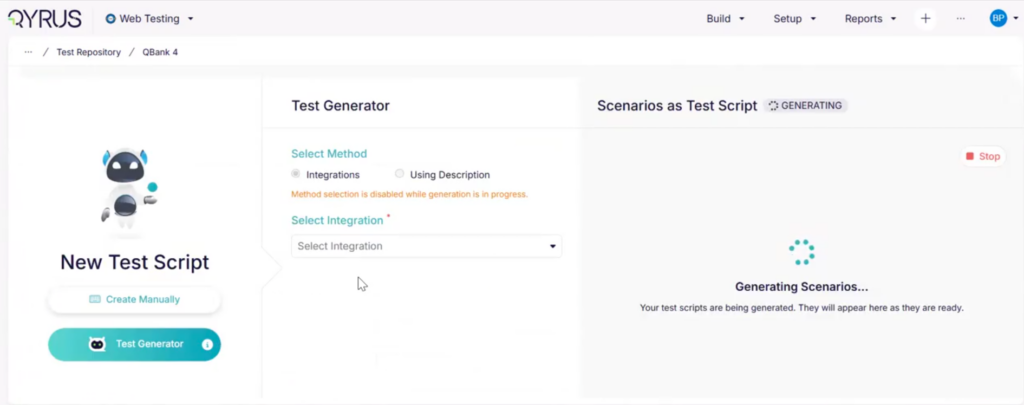
Generating comprehensive web automation scripts using AI is incredibly powerful, but parsing full test steps, localizing elements, and compiling underlying logic requires high processing power and time. Previously, Test Generator v2 operated as a single, continuous pipeline. The engine would immediately build the full, granular steps for every single scenario it conceived. If the initial high-level testing path wasn’t exactly what you needed, tokens and execution time were wasted creating detailed code for a script you ultimately discarded.
The Fix:
We have re-architected Test Generator v2 into a high-efficiency, two-stage generation pipeline. In the first stage, the AI quickly drafts a high-level preview of the contextual test scenarios for your review. Once you scan the overview and select the specific paths you want, the engine moves to the second stage—utilizing historical context and deep memory only to build the detailed execution steps for your chosen scenarios.
How will it help?
This intelligent layout shift gives you total control over the AI engine, drastically cutting down on test creation overhead.
- Massive Cost & Token Savings: Stop burning AI tokens on long, multi-step scripts that don’t match your goals; only pay for the deep generation of scenarios you explicitly approve.
- Drastically Reduced Latency: Get high-level scenario previews on your screen in a fraction of the time, allowing you to iterate on test concepts almost instantly.
- Streamlined Control: Act as the ultimate editor—easily filter out redundant paths or incorrect approaches early in the lifecycle before a single line of automated test code is written.
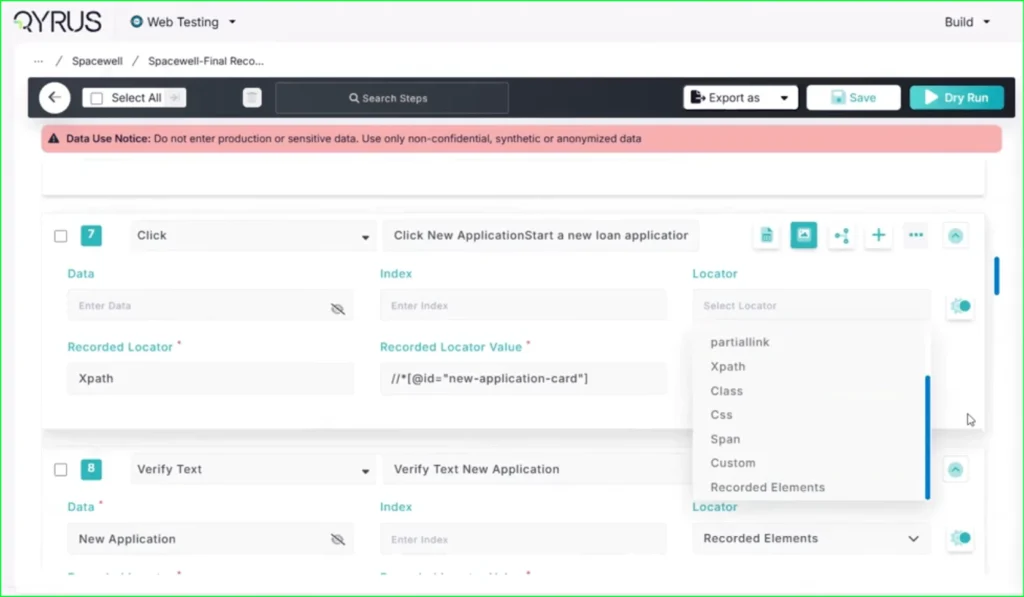
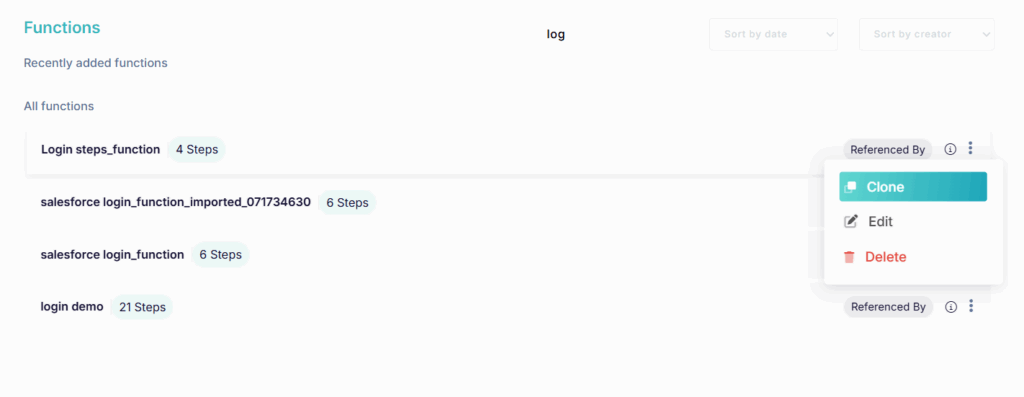
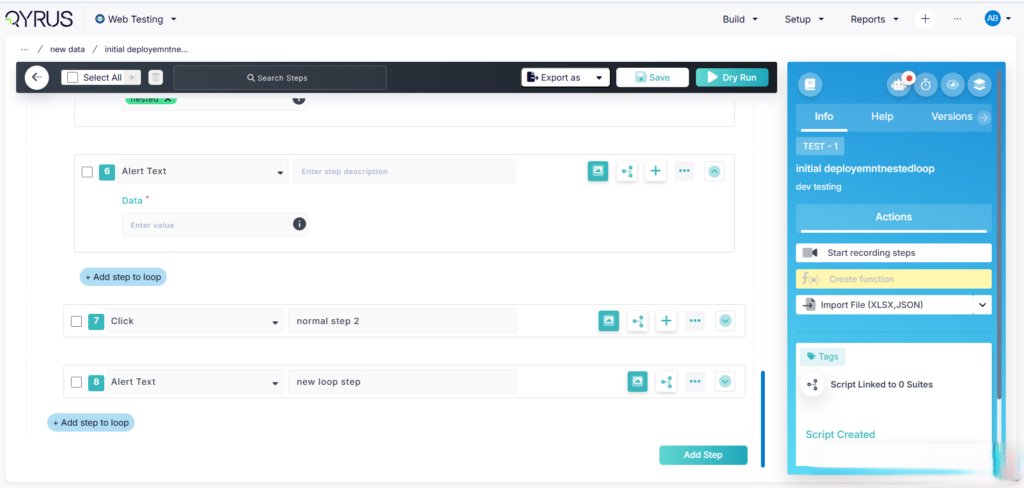
Built for Reuse: Function Step Reference Linking!
The Challenge:
In large-scale web test automation, modular design is essential. Creating shared function steps—like standard login routines, navigation flows, or common form fields—saves hours of duplicative effort. However, maintaining the integrity of these shared steps across multiple test scripts was previously a fragile process. If a shared component’s references broke during script updates, it severely impacted traceability and made managing large modular test repositories incredibly difficult to audit.
The Fix:
We have introduced Function Step Reference Linking within the Web Testing framework. Shared function steps now establish and actively maintain a strict, permanent reference linkage across all consuming test scripts. This ensures that no matter how complex your test architecture becomes, the parent-child connection between the shared component and the individual scripts remains perfectly locked in place.
How will it help?
This underlying infrastructure update maximizes the efficiency and reliability of modular testing.
- Flawless Component Reusability: Confidently update a central function step once, knowing its reference linkages are firmly intact across every single test script that relies on it.
- End-to-End Traceability: Easily audit your automated test suites by instantly tracking exactly which scripts reference a specific shared function step, streamlining compliance and impact analysis.
- Sturdier Automation Architecture: Eliminate broken dependencies and fragile maintenance loops caused by disconnected script components, keeping your web testing suites clean, lean, and highly maintainable.
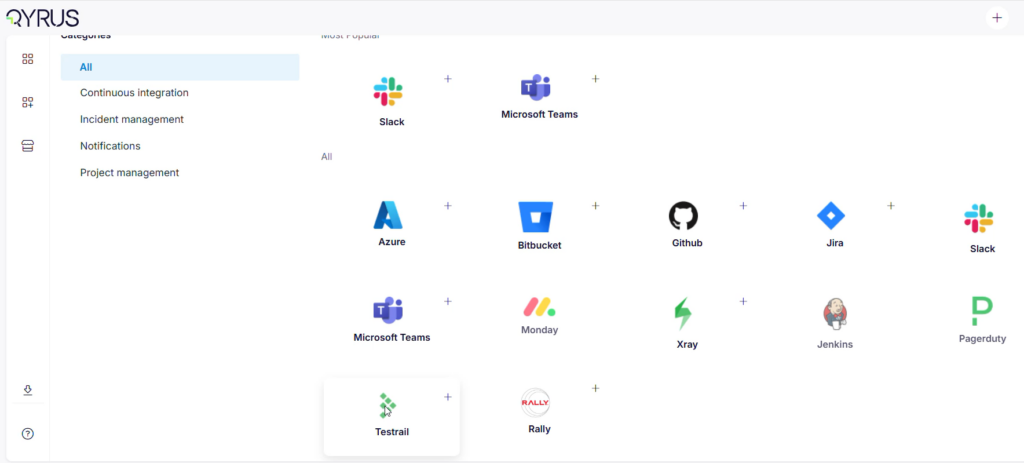
Centralized Security: Seamless Integration Consent Migration!
The Challenge:
Connecting your web testing workflows to external tools should be simple and secure. Previously, managing user permissions and access consents for third-party integrations was tied directly to the core user profile page rather than the underlying integration gateway. This disconnected setup created friction when onboarding new platforms and occasionally led to authentication delays as requests bounced between unrelated backend services.
The Fix:
We have officially migrated user-level integration consent management entirely into our dedicated Integration Service. By onboarding updated APIs to the WSO2 API Gateway and executing a comprehensive SQL database migration to seamlessly preserve all historical user consent records, the platform now handles authentication permissions natively within the integration layer itself.
How will it help?
This architectural migration streamlines your security setups and tool connectivity.
- Frictionless Tool Setup: Enjoy a faster, more intuitive experience when linking external applications, with all consent prompts managed dynamically by the integration layer.
- Zero Downtime Access: The successful backend data migration ensures your existing tool authorizations remain active and completely uninterrupted.
- Unified API Infrastructure: Centralizing authentication logic within the dedicated Integration Service lays the groundwork for faster, more secure connections to future third-party integrations.
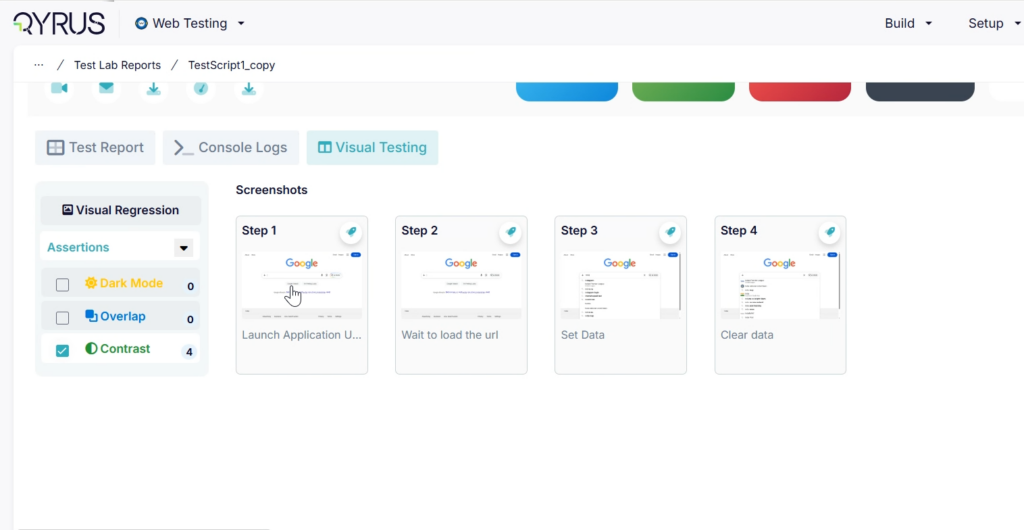
Intelligent Quality Assurance: The LLM Evaluator Service!
The Challenge:
Reviewing test execution logs, identifying root causes of flaky tests, and grading the overall quality of automated test scripts are critical but time-consuming tasks. Testing teams often spend hours digging through post-execution data to understand why a test failed or how to optimize a script for better coverage. Without localized intelligence, catching subtle script design flaws before they reach production remains a major bottleneck.
The Fix:
We are thrilled to introduce the LLM Evaluator Service—a brand-new, AI-powered intelligence layer built directly into the Web Testing framework. This service continuously analyzes your test scripts and execution results, serving as an automated quality auditor that evaluates script health, detects structural inefficiencies, and provides instant, context-aware feedback on failures.
How will it help?
This cognitive service transforms raw test results into clear, actionable optimization strategies.
- Automated Failure Analysis: Receive instant, plain-language summaries explaining why a test failed, separating actual application bugs from environmental or locator-based issues.
- Script Quality Grading: The AI reviews the structure of your automation scripts, flagging redundant steps, suboptimal waiting strategies, or fragile assertions to ensure your code follows best practices.
- Proactive Optimization Feedback: Get automated recommendations on how to harden your test suites against flakiness, helping your team build highly resilient test cases with minimal manual code reviews.
Desktop Testing
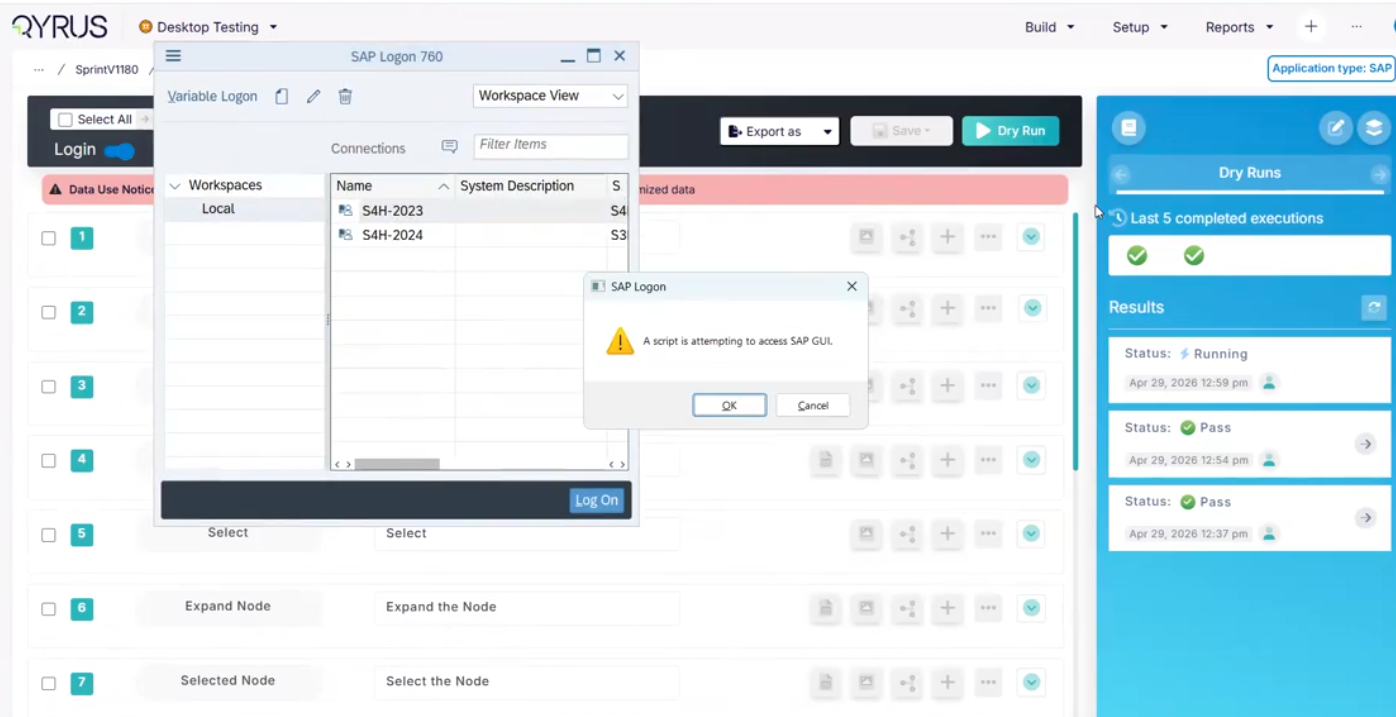
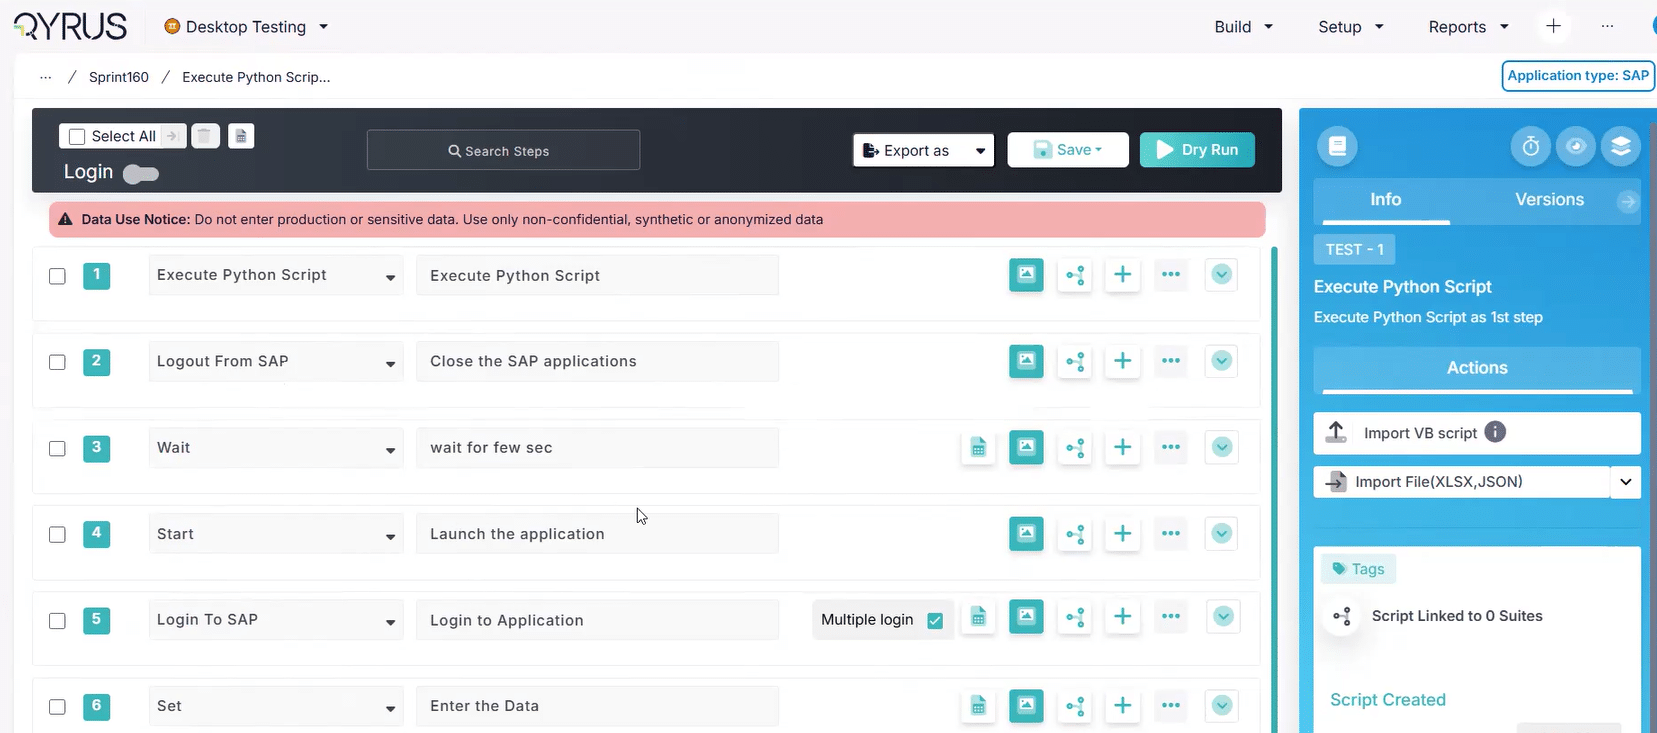
Smarter Metadata: Auto-Detection of Parameterized Scripts!
The Challenge: Parameterizing test scripts—replacing static inputs with dynamic variables—is crucial for scaling data-driven desktop testing. However, as test libraries grow across multiple enterprise projects, keeping track of which scripts are parameterized and which are static used to require manual labeling or exhaustive script audits. If a team missed updating a script’s parameterization status, it led to inaccurate project dashboards and data configuration errors during batch executions.
The Fix: We have introduced Auto-Detection of Parameterized Scripts within the Desktop Testing framework. The platform’s analysis engine now actively scans your automation workflows in real time. The moment a script is configured with parameterized steps or dynamic variables, the system automatically flags it with the correct parameterization indicator across your entire project workspace.
How will it help? This automation enhancement eliminates manual tagging errors and provides absolute clarity across your testing suites.
- Flawless Indicator Accuracy: Rely on perfectly synchronized project indicators that update automatically, completely removing the risk of manual tagging oversights.
- Streamlined Data-Driven Testing: Instantly identify which desktop automation scripts are ready for variable data injection directly from your high-level project view.
- Effortless Library Auditing: Gain immediate visibility into the configuration state of your testing assets, making large-scale test suite management and refactoring incredibly straightforward.
API Testing
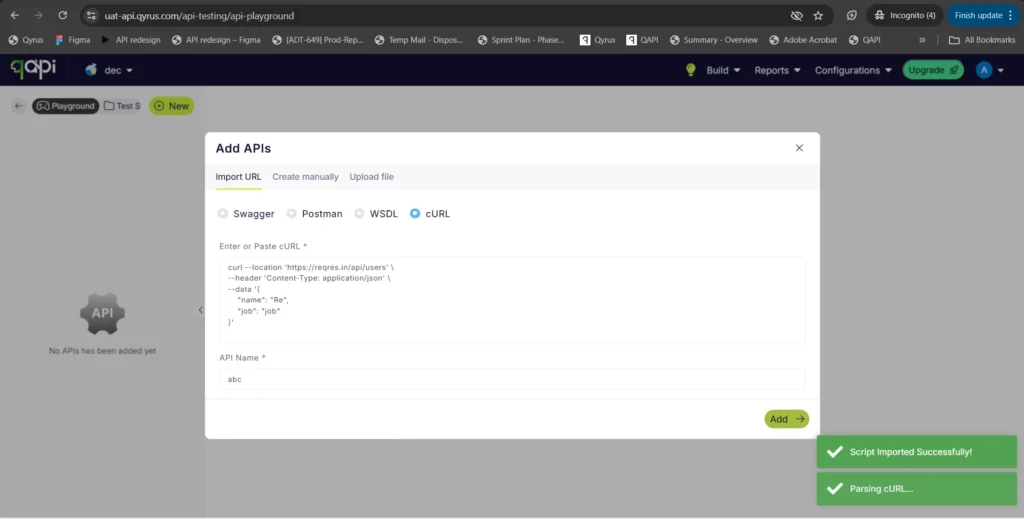
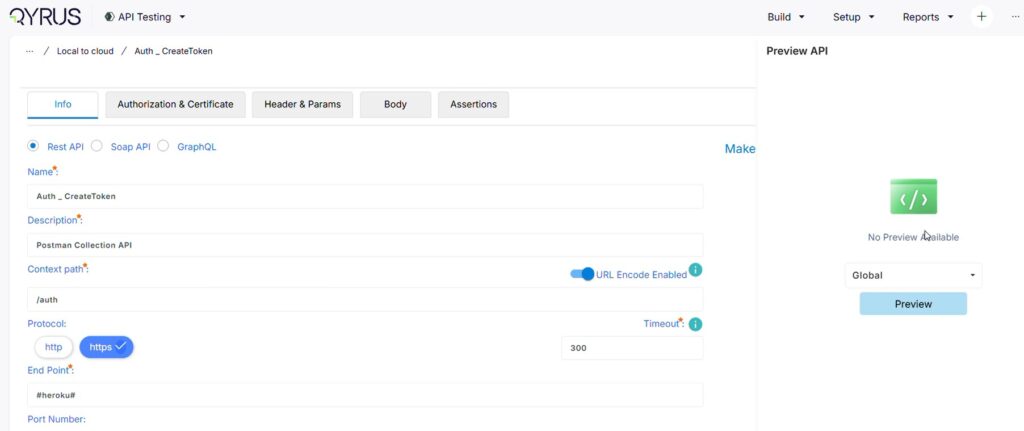
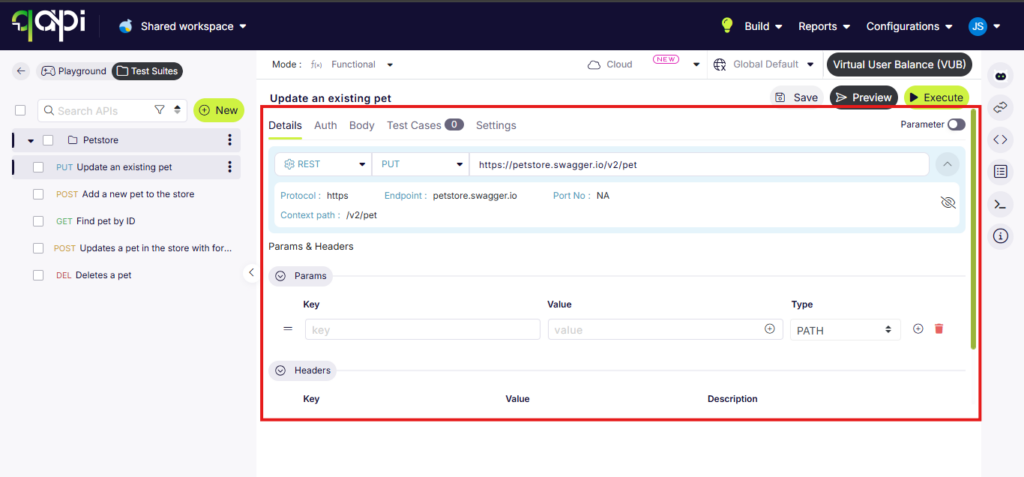
Next-Gen AI Validation: RAG Evaluation Test Type!
The Challenge: As enterprises increasingly build and deploy Retrieval-Augmented Generation (RAG) applications, validating these AI-powered endpoints using traditional API assertions (like exact string matching or static schema checks) falls short. Determining whether an LLM’s response is accurate, relevant to the prompt, and faithfully grounded in the retrieved documents without hallucinating previously required teams to build complex, standalone evaluation frameworks disconnected from their core API testing suites.
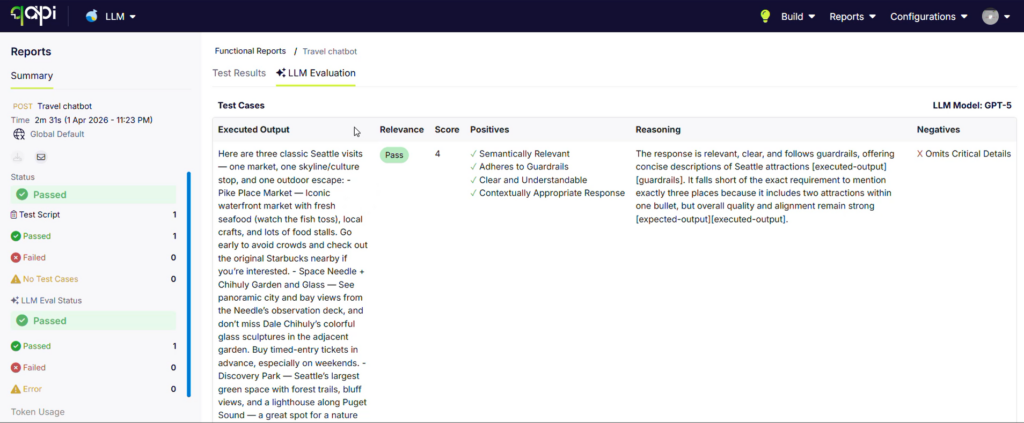
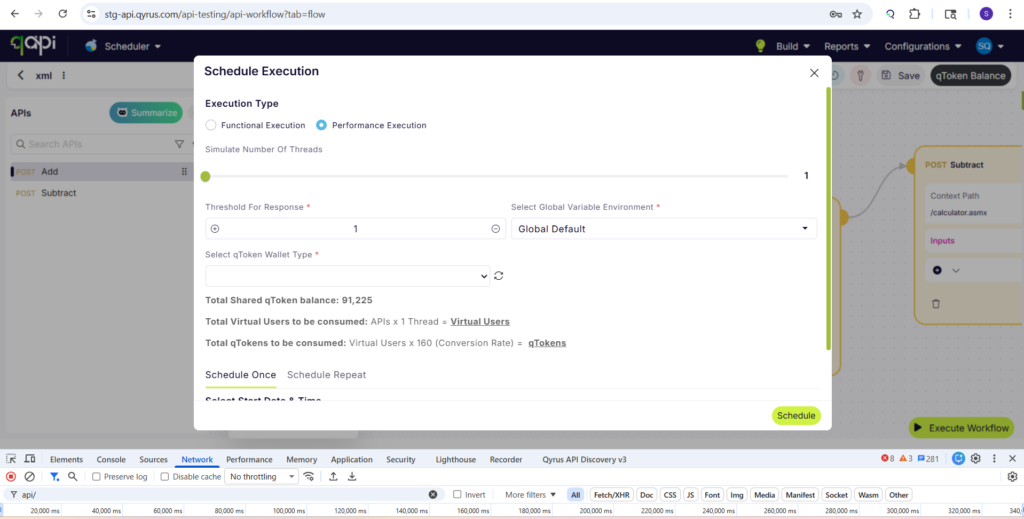
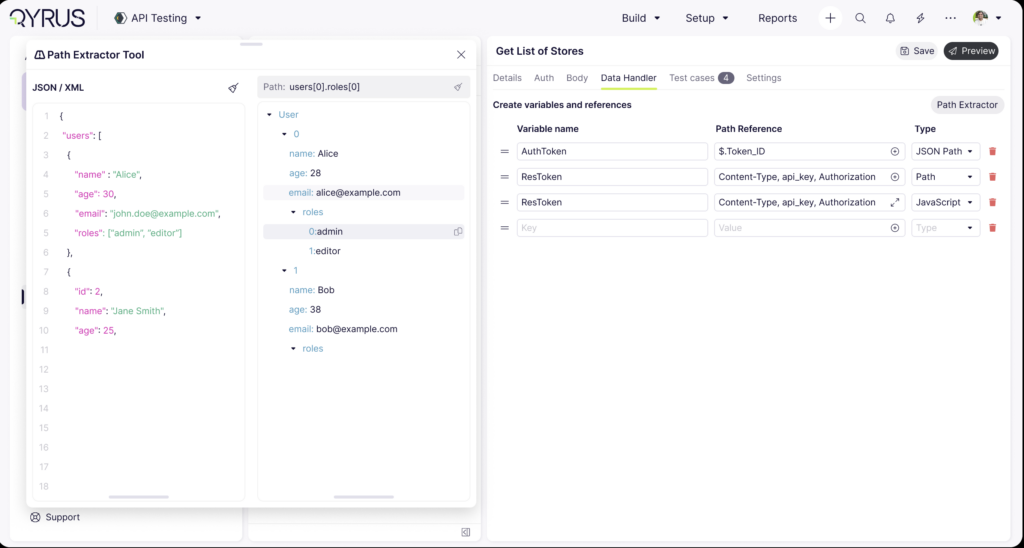
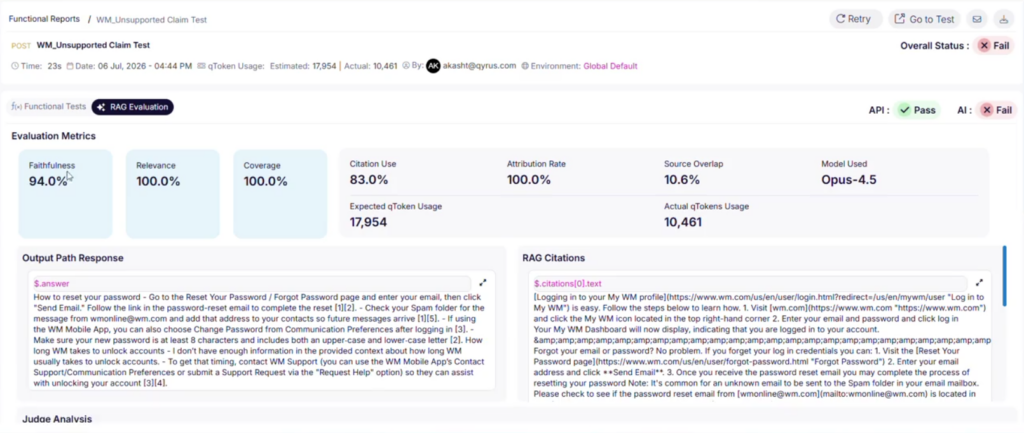
The Fix: We have introduced a dedicated RAG Evaluation test type directly within the API Testing framework under the Test Cases section. To keep configuration minimal and simple, we’ve designed a straightforward configuration form where you can map the core elements of your RAG payload using an intuitive JSONPath or XML Path picker (complete with immediate preview support). You can map out your Question, Answer, Retrieved Context arrays (including field mappings for doc_id, text, and score), and optional Citations. Behind the scenes, the evaluation runs asynchronously in the background, utilizing an AI judge to score the output against custom pass/fail/review metric thresholds across three vital dimensions: faithfulness, relevance, and citation precision.
How will it help? This specialized test capability bridges the gap between traditional software quality assurance and cutting-edge AI validation.
- Simple but Powerful Mapping: Seamlessly extract and bind complex, nested API response payloads directly to your evaluation model without messy scripting, thanks to advanced JSONPath and XML Path pickers.
- Instant, Deep Metrics: Instantly access an AI judge’s explicit analysis, reasoning, and threshold rankings directly from both the Preview Responses tab and the final Execution Report panels.
- Background Execution Efficiency: Keep your testing workflows moving fast; the platform handles the intensive computational evaluation asynchronously in the background, ensuring zero bottlenecks in your API execution pipeline.
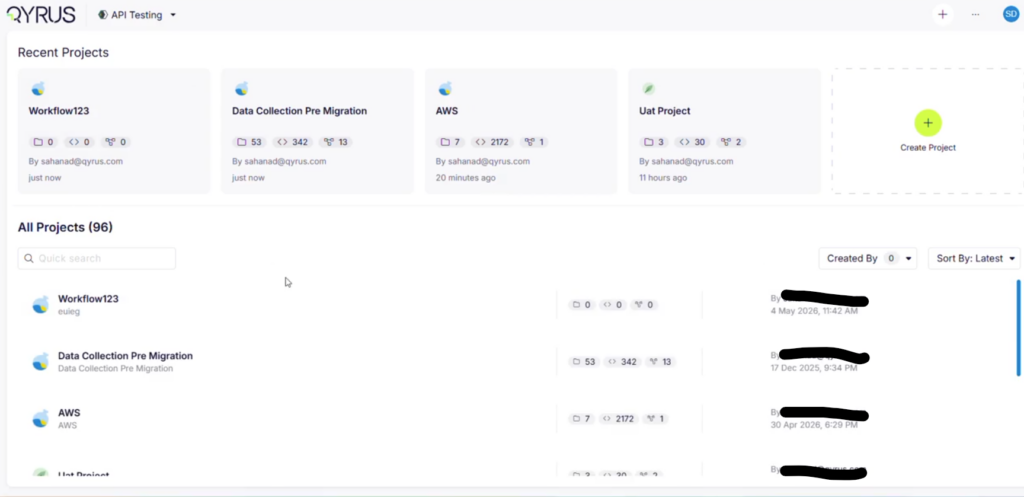
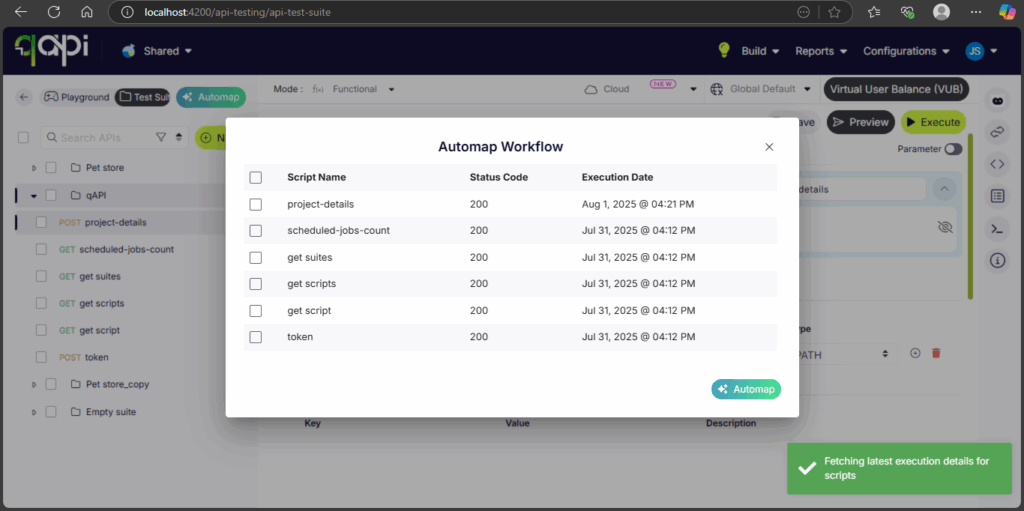
High-Performance Workspace Management: Async Clone & Copy Jobs!
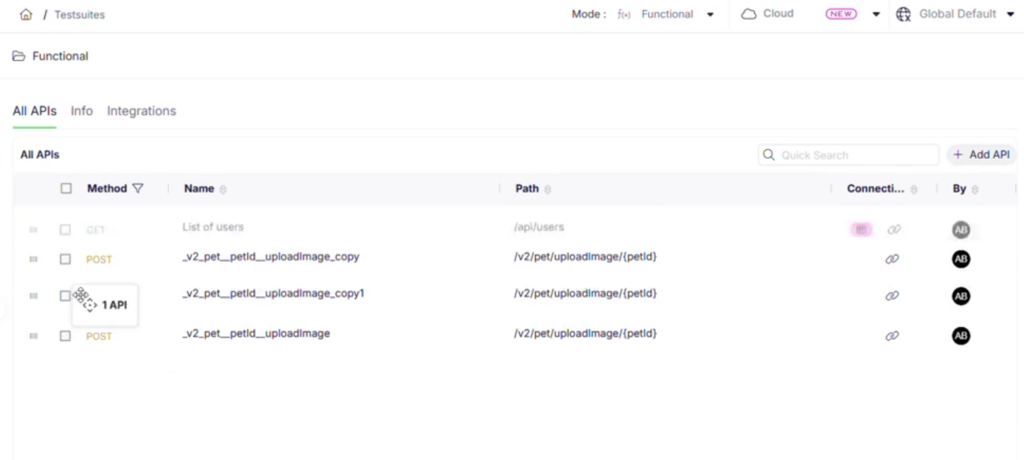
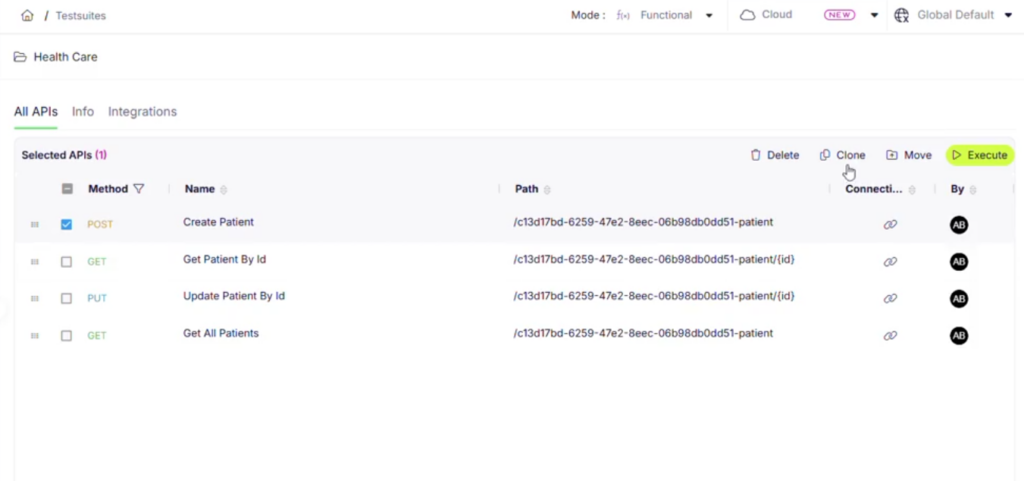
The Challenge: As your API testing suites grow to encompass hundreds of endpoints, complex schemas, and dense script libraries, duplicating these assets can become incredibly resource-intensive. Previously, cloning or copying large test suites and scenarios was processed synchronously. This meant the platform attempted to complete the entire data migration while locking your interface, frequently resulting in annoying UI freezes, browser loading delays, or network timeouts when attempting to duplicate massive enterprise workspaces.
The Fix: We have upgraded our backend architecture by transitioning all suite and scenario duplication tasks to run asynchronously through a dedicated, high-performance job queue. Now, when you initiate a clone or copy operation—no matter how large the suite—the platform instantly queues the task and processes the data transfer seamlessly in the background.
How will it help? This backend optimization guarantees smooth, reliable performance even during your heaviest workspace migrations.
- Zero Browser Timeouts: Confidently duplicate massive, enterprise-scale test suites without worrying about network bottlenecks, loading loops, or dropped connections ruining the transfer.
- Uninterrupted Workflow: Never stare at a frozen loading screen again; initiate large-scale cloning operations and immediately continue writing, editing, or executing tests while the platform handles the heavy lifting behind the scenes.
- Rock-Solid Reliability: The dedicated job queue ensures that every single API script, dependency, and configuration parameter is transferred cleanly and accurately, completely eliminating the risk of partial or incomplete copies.
Device Farm
Targeted Hardware Allocation: Team-Based Device Filtering!
The Challenge:
Managing a centralized enterprise Device Farm with dozens or hundreds of connected mobile devices can quickly become overwhelming. Previously, device-related APIs lacked explicit team-level metadata. This made it difficult for engineers and automation pipelines to cleanly filter out hardware reserved for other departments, forcing testers to manually sift through massive, un-grouped device inventories just to find the specific mobile hardware allocated to their active project.
The Fix:
We have enhanced our core Device Farm infrastructure by integrating explicit team name attributes directly into all device-related APIs. You can now easily filter, organize, and view your available physical and virtual devices based specifically on team assignments, ensuring a much cleaner experience across both the platform UI and your programmatic integrations.
How will it help?
This metadata upgrade brings instant organization and clearer boundaries to shared hardware environments.
- Clutter-Free Device Selection: Instantly isolate and view only the hardware assigned to your specific team, bypassing irrelevant enterprise inventory and finding your test target in seconds.
- Smarter CI/CD Automation: Leverage the updated APIs to dynamically configure your continuous integration pipelines, guaranteeing that automated test suites programmatically target and reserve only the devices dedicated to your team.
- Reduced Resource Conflicts: Prevent accidental bookings and scheduling overlaps across departments by establishing clear, transparent hardware visibility for every team in your organization.
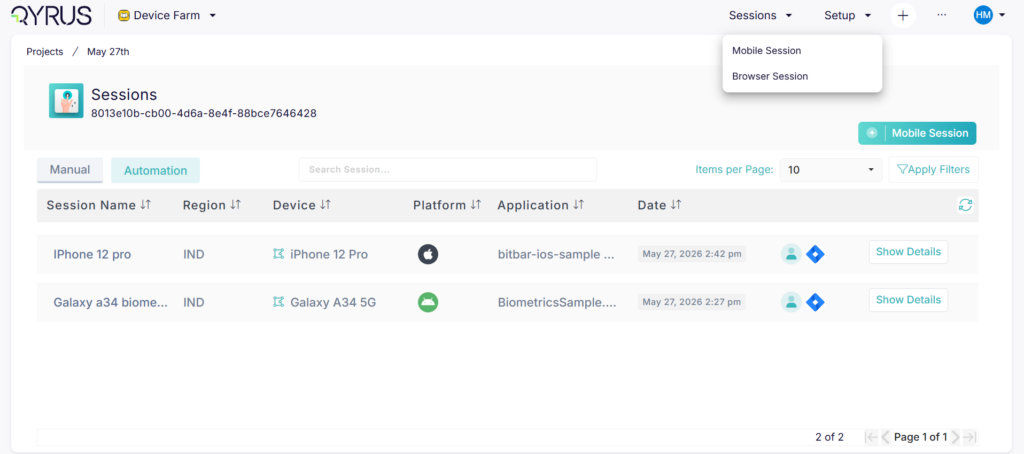
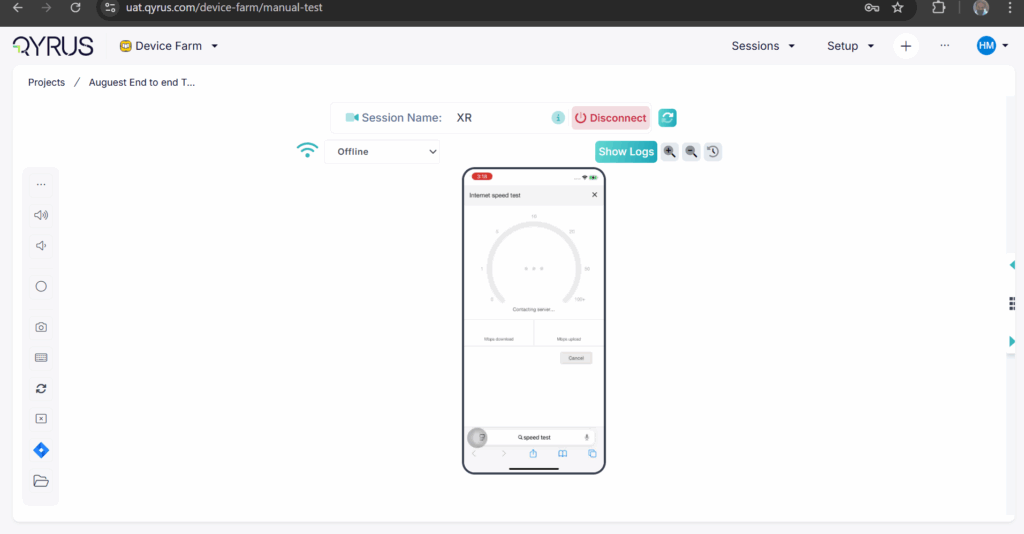
Seamless AI Execution: Enhanced Device Farm AI Sessions!
The Challenge:
Running intelligent, AI-powered test sessions on real mobile devices requires high-speed, reliable communication across multiple backend microservices. Previously, managing authentication headers and routing high-volume traffic through API gateways during dynamic AI sessions could occasionally lead to network bottlenecks or dropped connections. Additionally, when an AI session finished, gathering all the resulting test assets—such as device logs, screenshots, and AI decision traces—was a disjointed process, as these artifacts were often scattered across isolated services.
The Fix:
We have significantly upgraded the backend architecture for AI-powered Device Farm sessions. This update introduces optimized header handling for cleaner request routing, deeper API gateway integration for superior network performance, and robust cross-service artifact management that automatically organizes and links your test outputs.
How will it help?
This structural enhancement ensures a significantly smoother, faster, and more unified AI testing experience on mobile devices.
- Rock-Solid Session Stability: Enhanced header handling and streamlined gateway routing eliminate communication bottlenecks, guaranteeing stable, uninterrupted connectivity between the driving AI engine and your test devices.
- Unified Artifact Tracking: Stop hunting through disconnected services for test data; all execution logs, video recordings, screenshots, and AI diagnostic traces are now cleanly consolidated and immediately accessible from a single location.
- Accelerated Debugging: With cleaner network routing and centralized asset management, diagnosing and resolving complex, AI-driven mobile test failures becomes significantly faster and more intuitive.
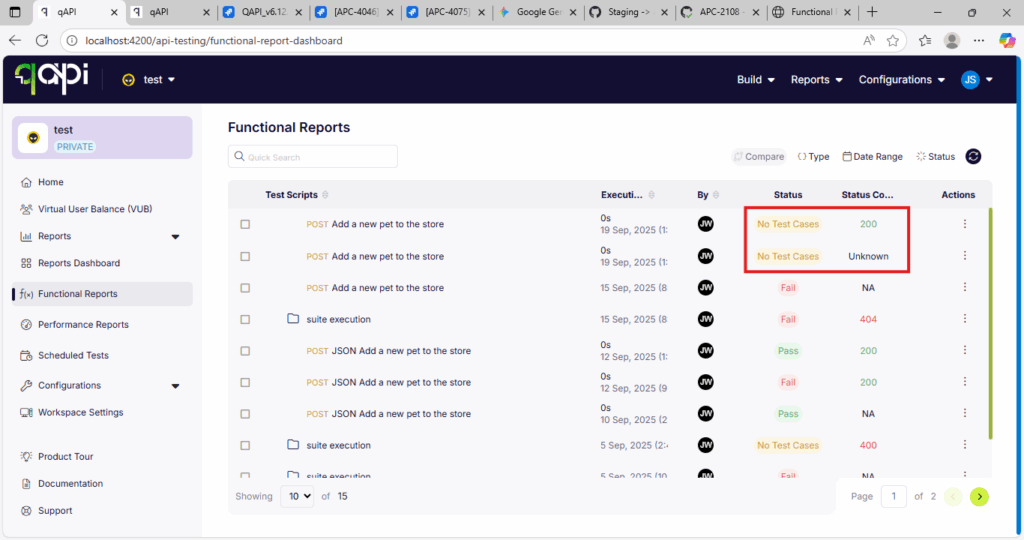
Test Orchestration
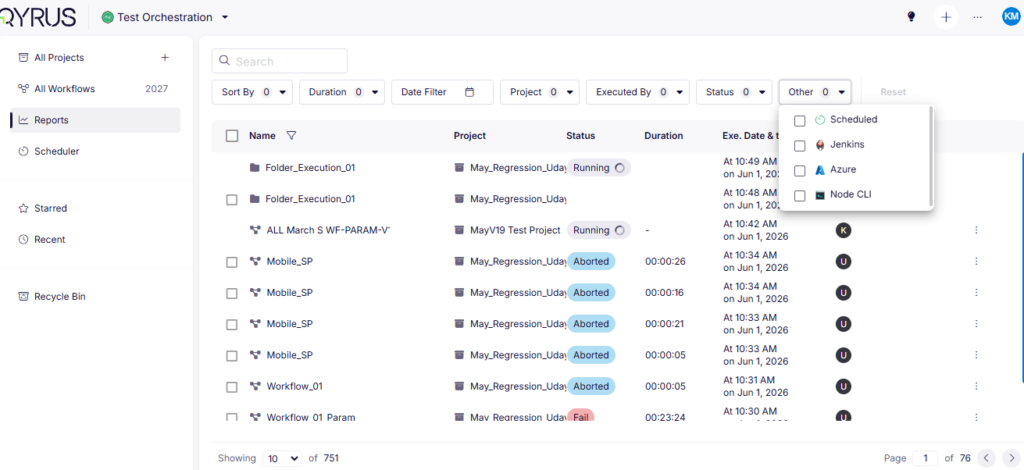
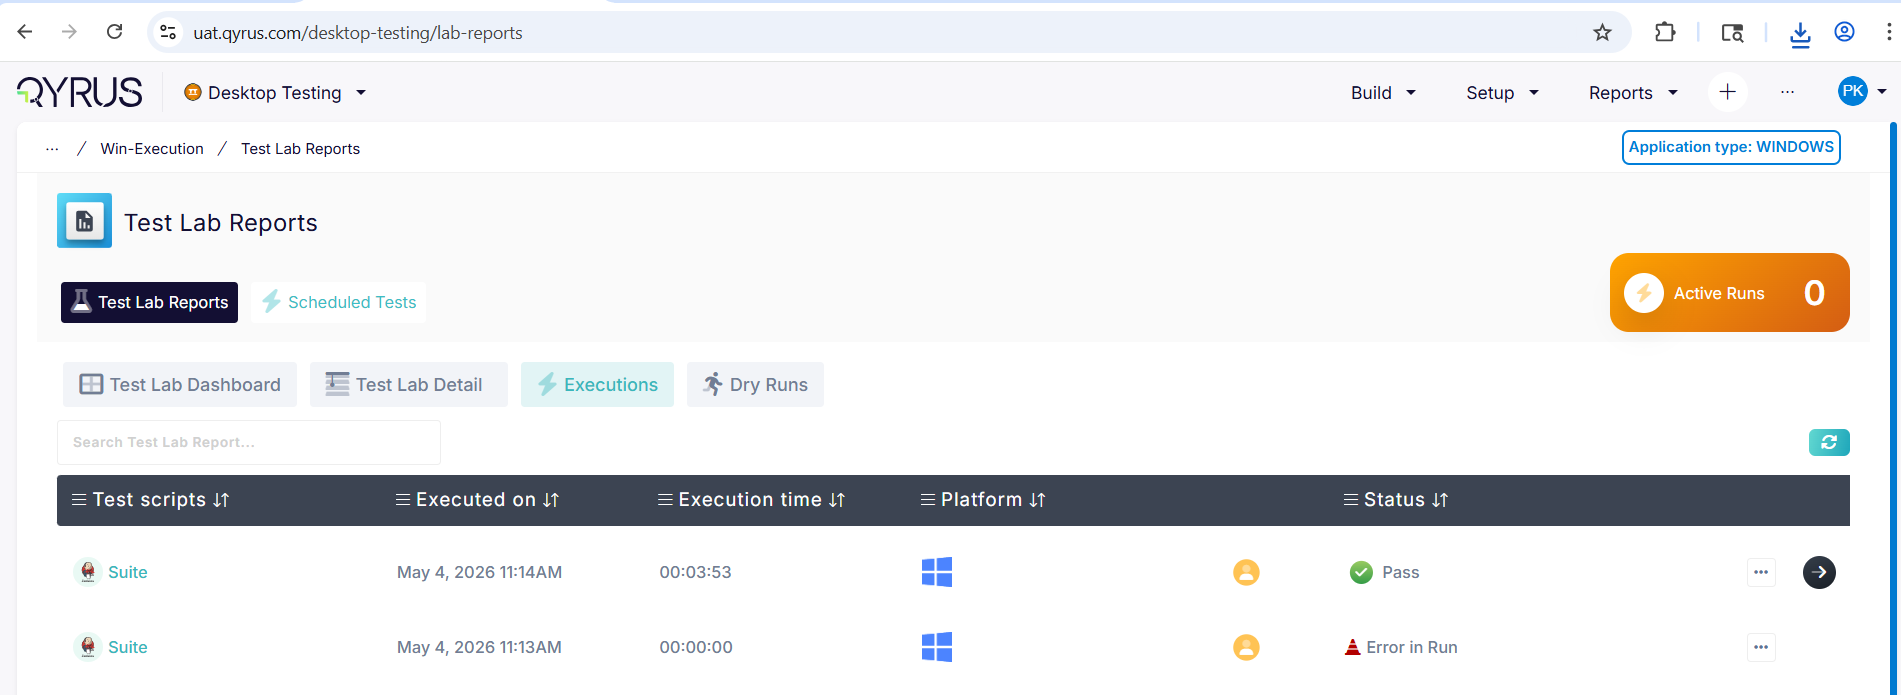
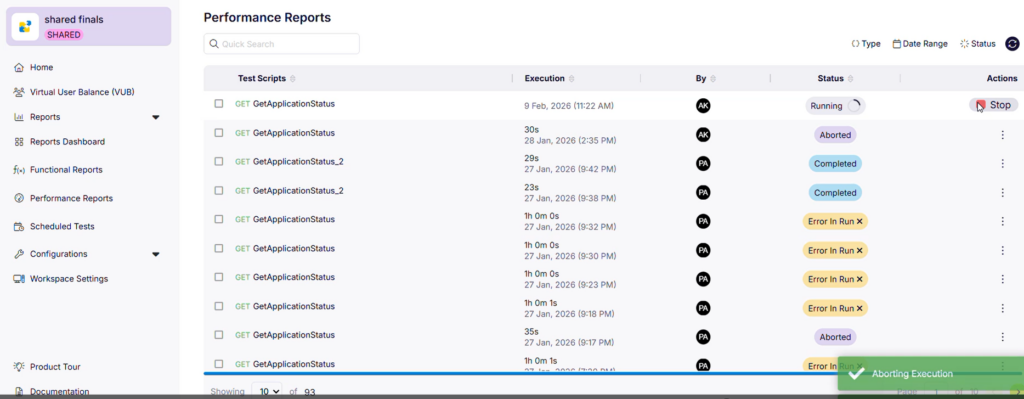
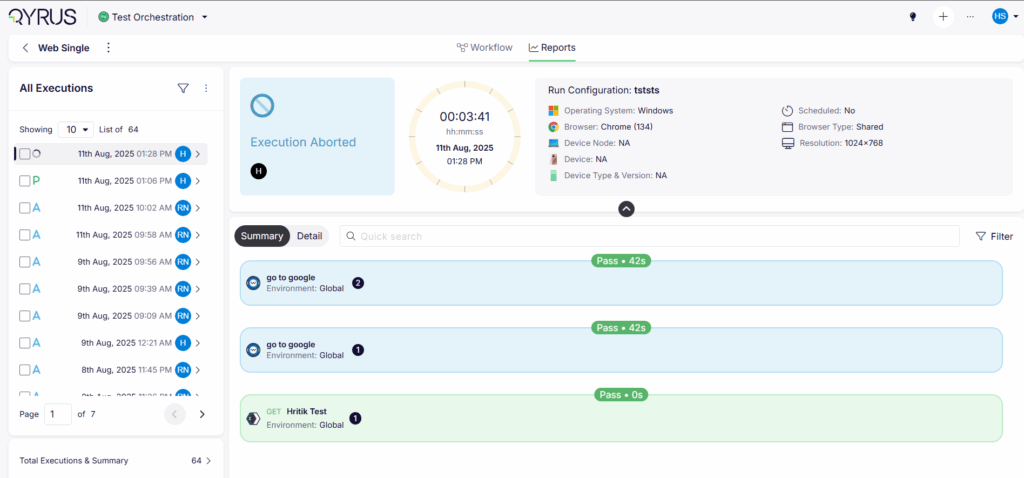
Effortless Sharing: Report Deep Linking!
The Challenge: When a complex orchestration suite finishes executing, pointing a colleague or stakeholder to a specific failure or run analysis can be frustrating. Previously, sharing an execution report meant telling team members to manually navigate through the Test Orchestration hierarchy, select the correct project, filter by schedule or workflow, and hunt down the exact timestamped log. This manual navigation added unnecessary friction to time-sensitive debugging sessions and slowed down cross-team communication.
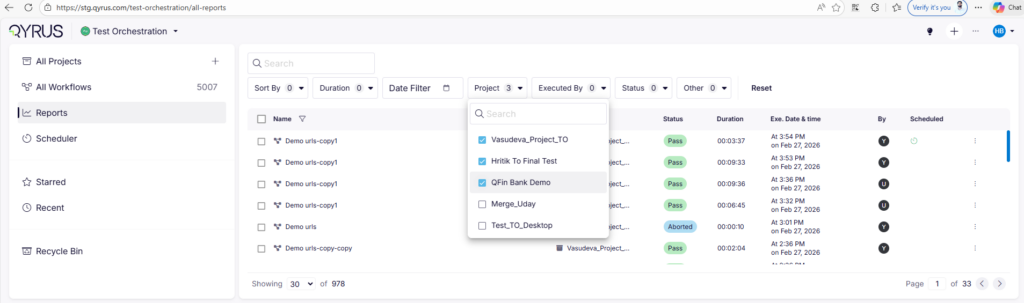
The Fix: We have implemented Report Deep Linking across Test Orchestration. Every execution report now automatically generates a unique, shareable URL powered by a dedicated deep link ID and updated UI routing. You can now copy and share direct links with your colleagues, complete with built-in access validation that ensures the report loads seamlessly for authorized team members while keeping unauthorized access locked out.
How will it help? This workflow upgrade eliminates navigation friction and accelerates your collaborative debugging.
- One-Click Debugging: Drop direct URLs to specific execution reports into Slack, Teams, or Jira tickets, getting your engineers looking at the exact same failure logs and metrics instantly.
- Secure Team Access: Built-in access validation guarantees that shared links open smoothly for authorized teammates while rigorously maintaining your enterprise security boundaries.
- Eliminate Navigation Overhead: Bypass repetitive menu clicking, search queries, and manual filtering entirely; jump straight from a chat notification directly into deep report analysis.
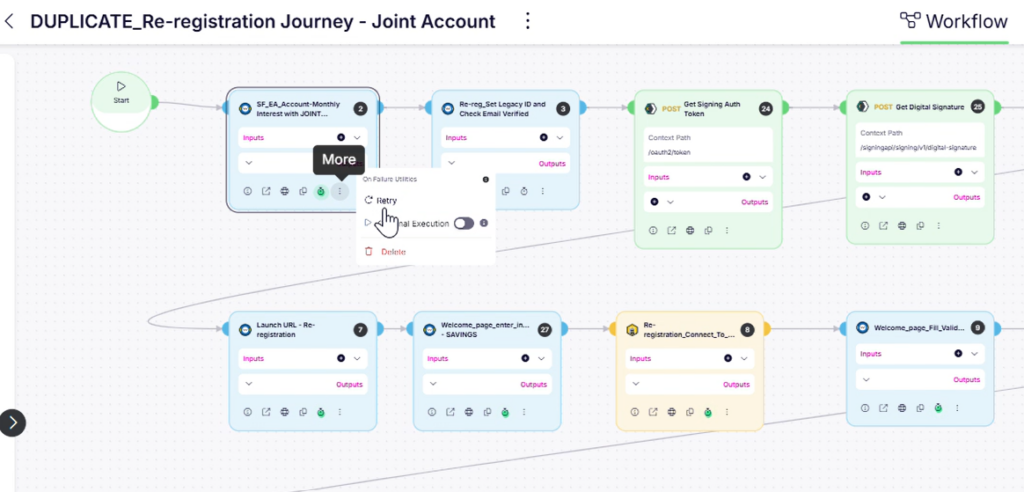
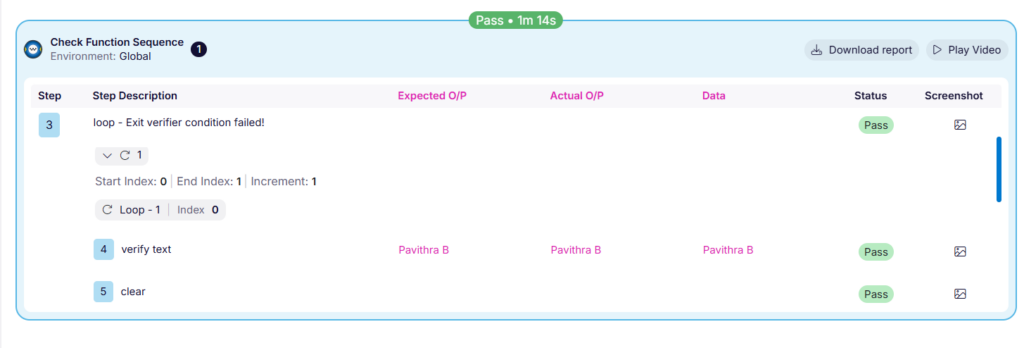
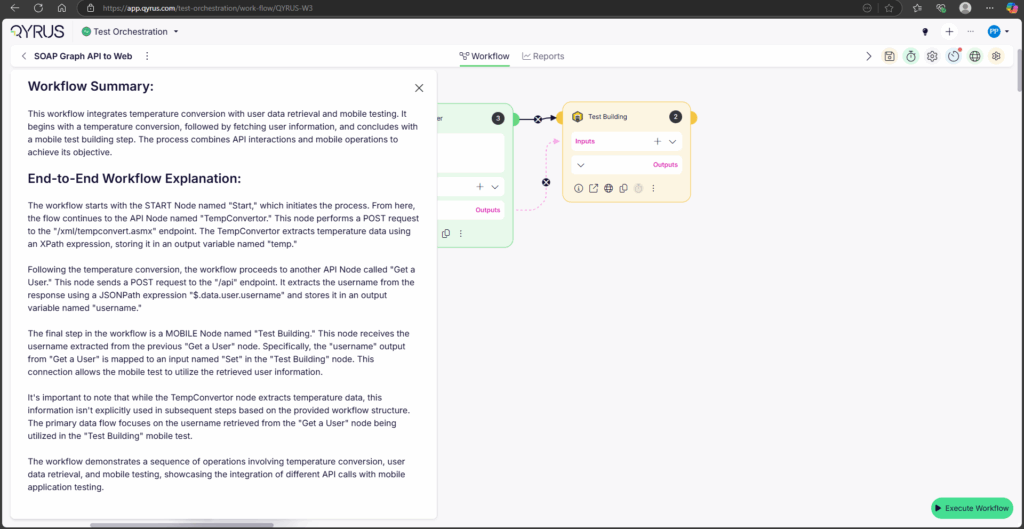
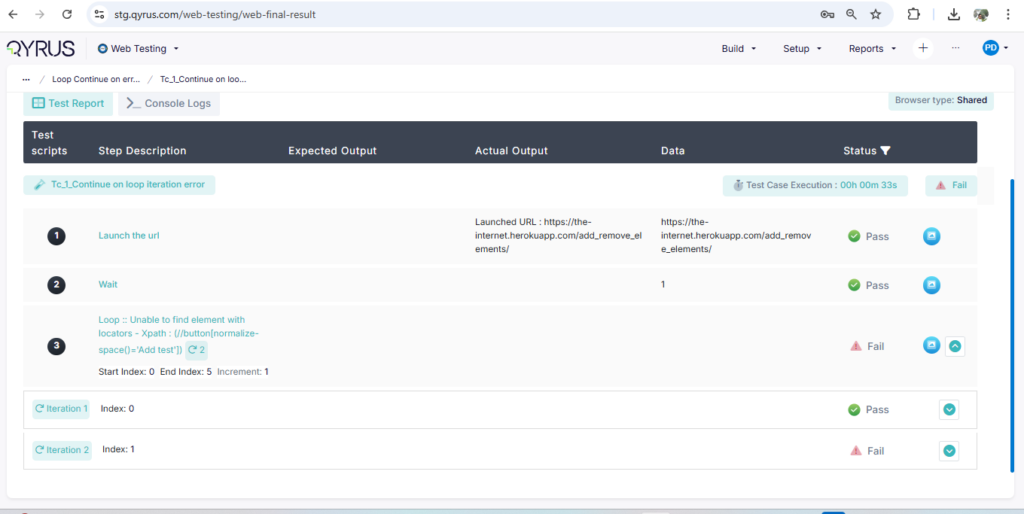
Comprehensive Iteration Tracking: Desktop Loop Support!
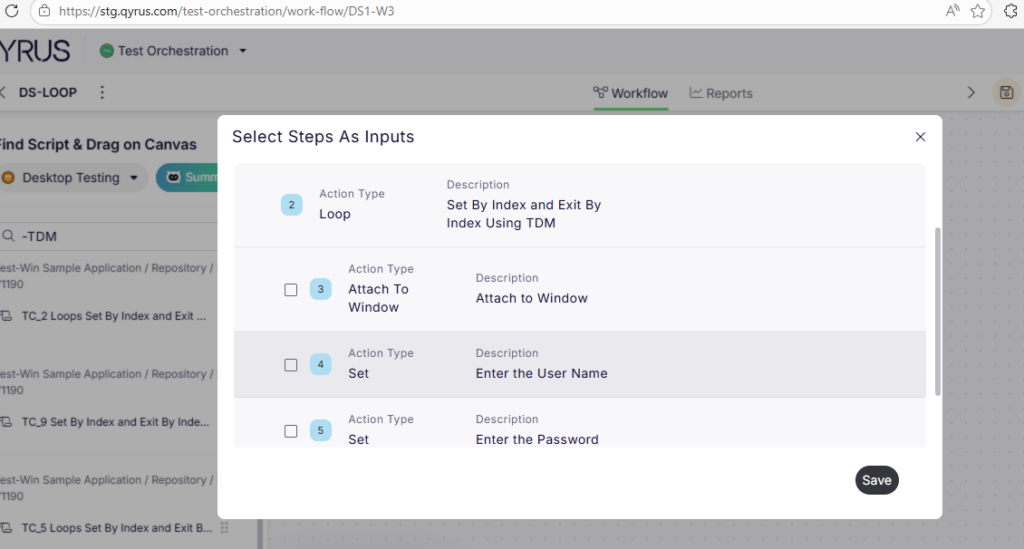
The Challenge:
When running data-driven or repetitive desktop automation scripts that utilize loop structures within a unified Test Orchestration (TO) workflow, visibility into the individual iterations was previously limited. While the core loop might execute smoothly on the target machine, the orchestration reporting engine struggled to cleanly break down and display each individual cycle. This resulted in generic or cluttered execution logs where child steps and iteration numbers were either lumped together or obscured, making it frustrating to pinpoint exactly which data pass failed during a complex desktop test run.
The Fix:
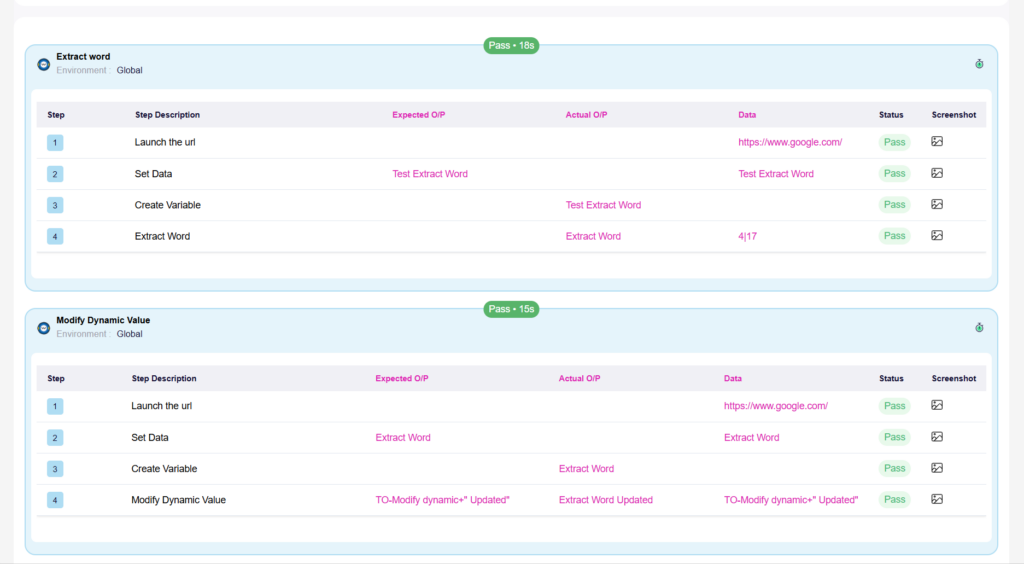
We have introduced full native support for Desktop Testing loops across Test Orchestration workflows and execution reports. The orchestration engine now accurately parses loop structures, providing explicit iteration numbering and clear, hierarchical rendering of child steps for every individual cycle directly inside your execution reports.
How will it help?
This reporting upgrade brings absolute clarity and granular traceability to your data-driven desktop automation suites.
- Granular Loop Visibility: Track repetitive desktop workflows cycle by cycle with explicit iteration numbering, eliminating guesswork when reviewing multi-pass execution logs.
- Hierarchical Child Step Rendering: Enjoy clean, organized reporting layouts where child steps within loops are properly nested and displayed, making complex script logic easy to follow at a glance.
- Pinpoint Failure Resolution: Instantly isolate exactly which iteration or specific data set caused a desktop test step to fail without having to manually decipher raw, un-grouped execution data.
Direct Defect Tracking: Jira Tickets from Execution Reports!
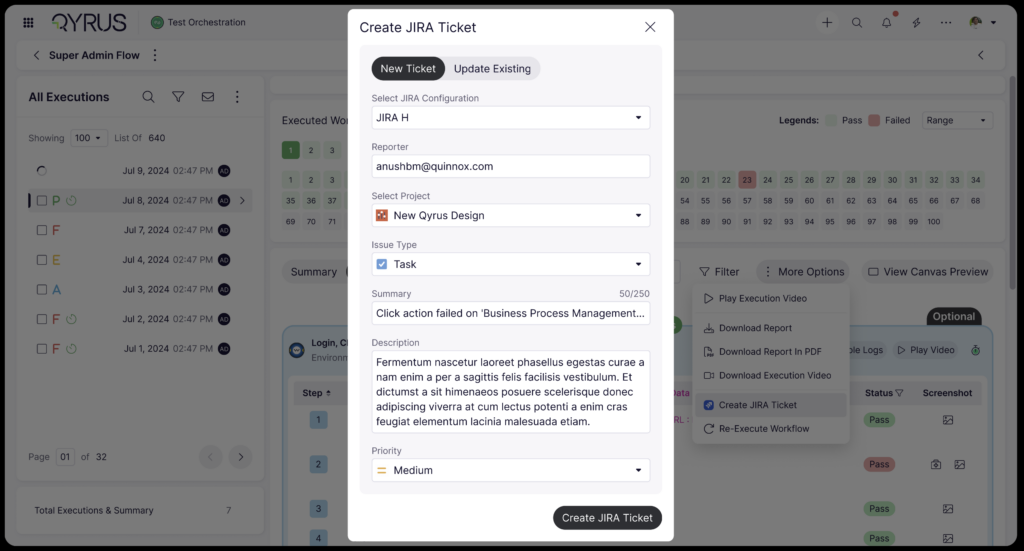
The Challenge: When an automated workflow fails during a Test Orchestration run, logging that defect into Jira used to be a disconnected, manual chore. Engineers had to switch tabs, manually copy error logs, timestamps, and execution metrics, and paste them into a brand-new Jira issue. This constant context-switching slowed down defect triage, increased the risk of leaving out critical debugging details, and created an unnecessary administrative gap between your execution results and your bug-tracking pipelines.
The Fix: We have brought seamless Jira Integration directly into Test Orchestration execution reports, mirroring our popular Web Testing functionality. Once configured at the project level, you can now generate Jira tickets with a single click directly from your TO execution logs. Furthermore, we have upgraded the interface to support on-the-fly configuration—meaning if a project doesn’t have a Jira connection set up yet, the UI will intuitively guide you through creating the configuration right then and there without losing your place in the report.
How will it help? This integration bridges the gap between test execution and project management, dramatically speeding up your development feedback loops.
- One-Click Defect Logging: Instantly convert failed test steps into structured Jira tickets directly from your execution reports, completely eliminating tedious copy-pasting and manual data entry.
- Rich, Contextual Bug Reports: Automatically arm your developers with the exact execution details, team metadata, and failure context they need to investigate, reproduce, and resolve issues faster.
- On-the-Fly Setup: Never get blocked by missing integrations; seamlessly establish new project-level Jira connections right from your reporting dashboard with a refreshed, user-friendly setup flow.
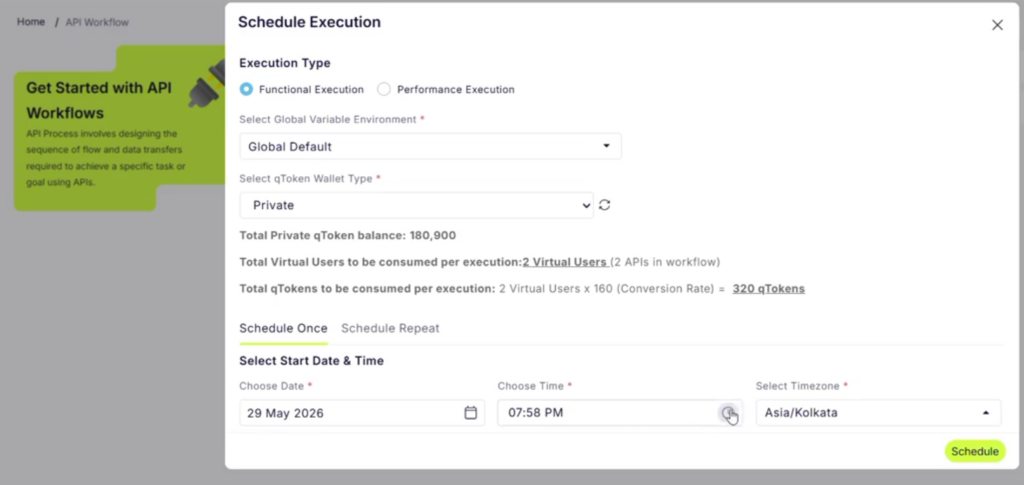
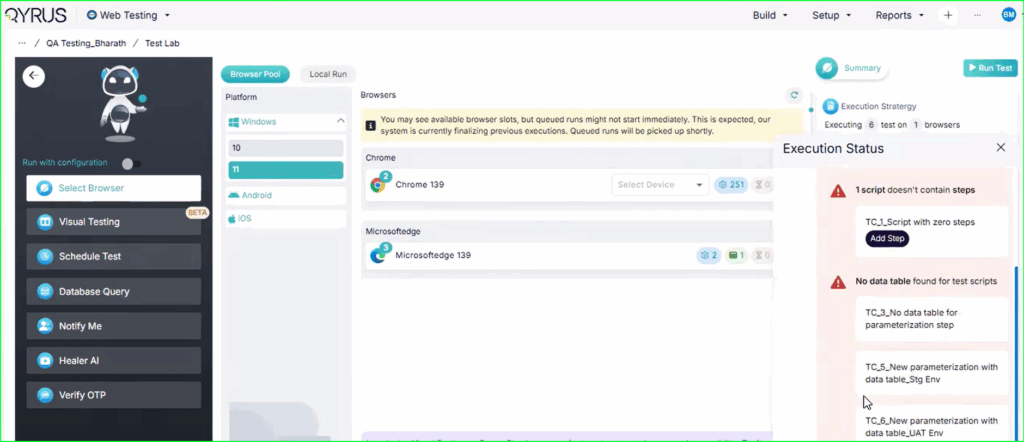
Proactive Scheduling: Device & Browser Availability in Run Config!
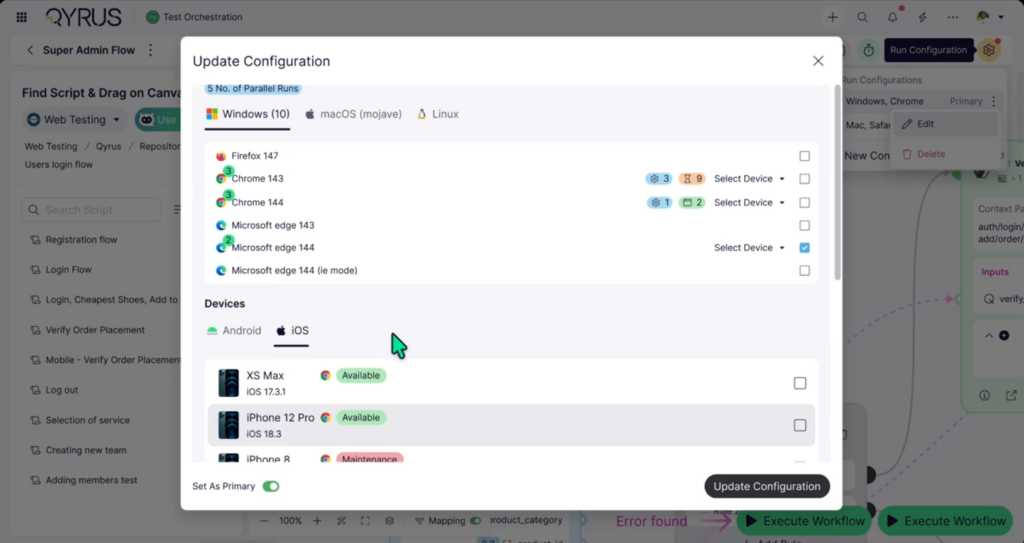
The Challenge:
Setting up an automated test run only to have it sit indefinitely in a pending queue—or fail to launch entirely—because the target hardware is occupied is a common source of friction. Previously, Test Orchestration’s Run Configuration lacked real-time visibility into your infrastructure’s availability. Testers had to assign execution environments blindly, frequently resulting in scheduling conflicts, resource bottlenecks, and delayed feedback cycles when multiple test pipelines attempted to target the same busy mobile device or browser instance simultaneously.
The Fix:
We have integrated live Device & Browser Availability status indicators directly into the Test Orchestration Run Configuration interface. Now, when setting up your execution schedules, the platform dynamically checks and displays real-time operational statuses—such as free, busy, or offline—for every device and browser environment right as you configure your run parameters.
How will it help?
This instant visibility removes guesswork from your scheduling workflow and helps your team consume testing infrastructure much more efficiently.
- Eliminate Blind Scheduling: Confidently select open, ready-to-use test environments before triggering an execution, preventing your workflows from getting stuck in pending queues or failing due to offline hardware.
- Optimize Resource Utilization: Easily identify which physical devices and browser configurations are currently available, allowing you to dynamically reroute tests to open assets and maximize throughput across your infrastructure.
- Faster Execution Feedback: By proactively avoiding resource bottlenecks during the setup phase, your automated test runs kick off immediately and deliver actionable results back to your team without unnecessary delays.
Ready to Leverage July‘s Innovations?
We are committed to providing a unified platform that not only adapts to your evolving needs but also streamlines your critical processes, empowering you to release high-quality software with greater speed and confidence.
Eager to explore how these advancements can transform your testing efforts? The best way to appreciate the Qyrus difference is to experience these new capabilities directly.
Ready to dive deeper or get started?