Enterprise Knowledge Graph: What It Is and How to Build One for Your IT Estate
 Varun RS
Your IT teams have no shortage of data. Monitoring tools show performance. Your service desk tracks incidents. Cloud consoles report usage. Yet when someone asks, “If we change this application, what else breaks?”, nobody has a confident answer.
That’s the gap an enterprise knowledge graph fills. Apps, servers, databases, the workflows riding on top of them (all of it goes in), and so do the wires between them. One query can then cover the whole estate. Compare that with what usually happens now: somebody pulls a CMDB export, somebody else opens two dashboards, and the answer arrives three days later in a meeting.
In this guide we’ll walk through what the thing is, why your CMDB keeps falling behind, five spots where a graph earns its money, and a six-step way to build one. It also covers the risks. A graph full of bad data can mislead people more than no graph at all.
What is an enterprise knowledge graph?
A knowledge graph has three parts. Nodes are the things: a server, an app, a department, a client. Edges are the relationships, each with a type such as “runs on”, “supports” or “calls”. Then there’s the ontology, a fancy word for the rulebook: which kinds of nodes and edges you’ll allow, and what you mean by each.
Why bother with edges? A server list answers “what do we have”. The graph also answers “what uses it”, down to the application and then to the business process behind that application.
Relational databases go the other way round. Rows sit in fixed tables and you glue them together with joins when you ask a question, which is great for order processing and not so great for a messy, shifting IT estate. In a graph the relationship is stored directly. Adding a new source or a new edge type, say “replicates to”, does not require a schema redesign.
Three kinds of enterprise graph
The term covers more than one thing. In practice, you will meet three types:
- Data-domain graphs connect customers, products and suppliers. Teams use them for fraud detection, customer views and supply chains.
- Work-content graphs link people, documents and conversations. They power enterprise search.
- IT-estate graphs model applications, infrastructure, services, business processes and the dependencies between them.
Most of what’s written online sticks with the first two. This one is about the third. IT-estate blind spots are the expensive ones for CIOs and enterprise architects, because they surface during outages and migrations.
Demand is strong across all three. Published estimates put annual growth in the enterprise knowledge graph market at about 21% to about 33%, depending on how each research firm defines the market.
Why static IT inventories fall short
Most shops lean on a configuration management database (CMDB) and a discovery scan that runs every so often. Trouble is, a scan is a snapshot. A container might live for ten minutes; a CI pipeline spins up new cloud resources before lunch. By the time anyone reads the record, it’s already a little bit wrong.
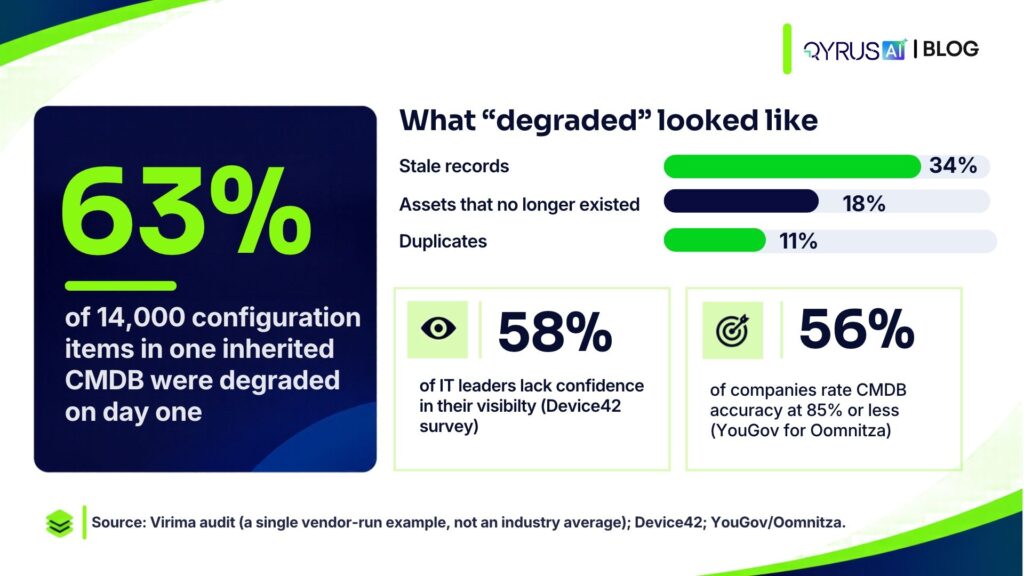
Surveys show the same gap. Device42 asked IT decision-makers about this, and roughly 84% said a CMDB is crucial. Yet most of them also admitted their records were patchy or low quality, and 58% didn’t trust their own visibility. Oomnitza commissioned YouGov to look at the same thing; over half of organizations pegged their CMDB accuracy at 85% or worse.
Here’s what that looks like up close. Someone inherited a CMDB with 14,000 configuration items, audited it, and found 63% of them broken in some way (34% stale, 18% pointing at kit that was long gone, 11% plain duplicates). This is a single vendor-run audit, not an industry average. Anyone who has maintained a CMDB by hand will recognize the numbers, though.
More effort will not fix this, because the gap is in the data model. Most tools record components. Few record relationships. For a single server, compare:
- The flat inventory gives you a name, an owner, and the date somebody last scanned the box.
- The graph tells you which apps live on it, which services call those apps, and which business process falls over if it dies.
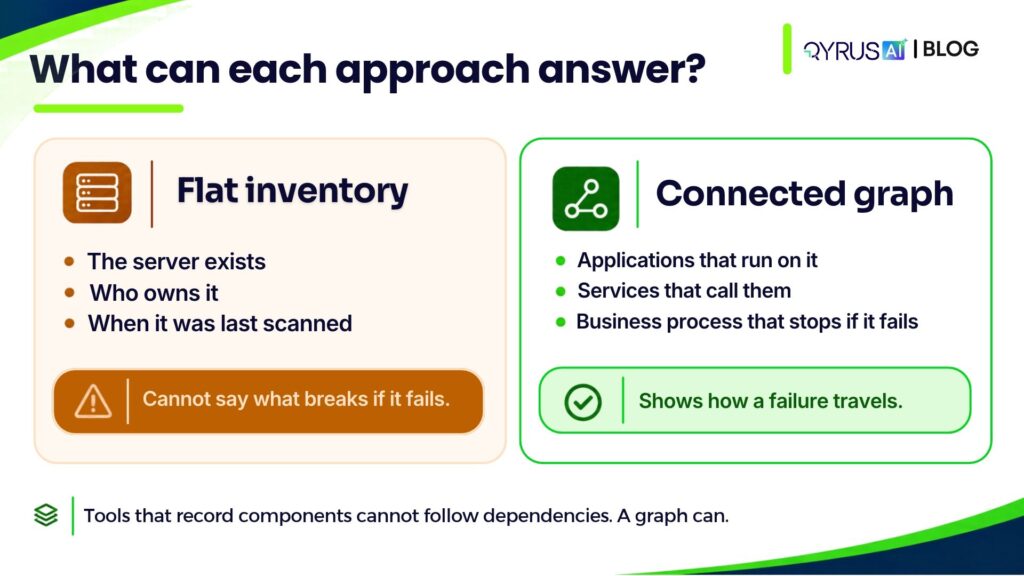
So a high-CPU alert on that box, with zero context? Noise, basically. And in connected systems trouble rarely stays where it started; it hops along dependencies, which is precisely the route a list of assets can’t show you.
How an enterprise knowledge graph works
Under the surface, four parts do the work.
- Discovery and ingestion. Feeds come from your monitoring stack, cloud APIs, service-desk tickets and whatever inventories already exist. If you can, run discovery all the time; quarterly is too slow.
- An ontology. The vocabulary everyone agrees on, so “application” means one thing to the architects and the ops team alike, along with the relationships allowed between them.
- Entity resolution. Different tools name the same thing differently. “payments-svc-01” in monitoring may be “Payments Server 1” in the CMDB. Entity resolution matches them into one node. Without it, the graph fills with duplicates and gives wrong answers.
- A living model. The graph updates when the environment changes. Queries follow edges through the model; nobody has to join tables by hand.
Where do graph databases fit? Think engine versus car. The graph database stores nodes and edges and traverses them quickly, and that’s it. PuppyGraph makes this point well: plenty of companies run a graph database and still don’t have a knowledge graph. What turns one into the other is the meaning you add, i.e. the ontology, resolved entities, relationships somebody actually checked.
A worked example: one server, three hops
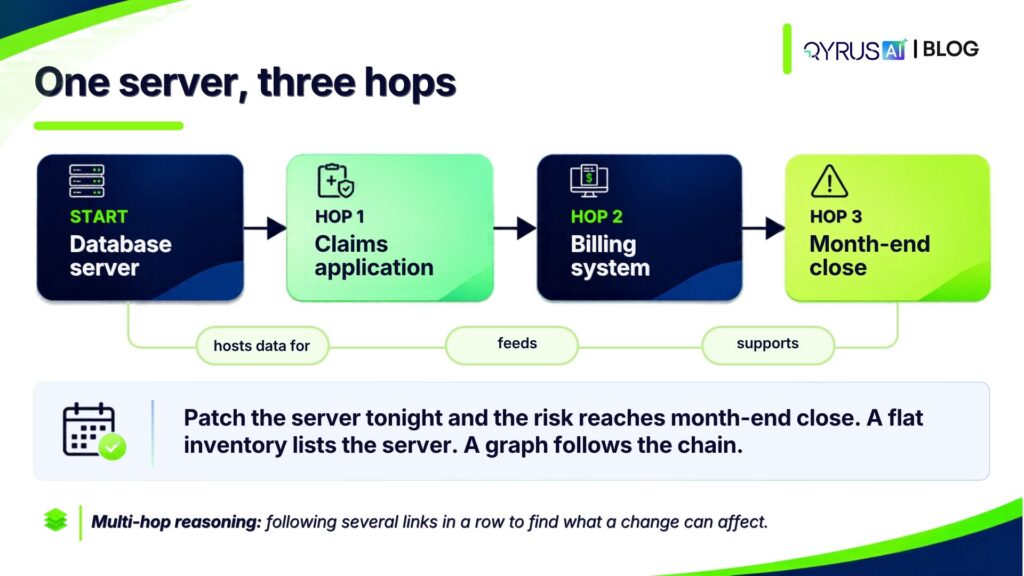
Picture a database server that hosts the data for your claims application. The claims application feeds your billing system. Billing supports the month-end close.
Now someone proposes patching that server tonight. A flat inventory lists the server and its owner. A graph follows three hops, from server to claims application to billing system to month-end close, and shows what is at risk. Following several links in a row is called multi-hop reasoning, and it is the question that static records cannot answer. (This example is illustrative.)
Five ways IT leaders use an enterprise knowledge graph
None of these are abstract. Each one lines up with a call a CIO or architect has to make.
- Change impact analysis
Patch tonight, upgrade next week, retire it next quarter? Either way the change board wants to know what else gets hit. The graph lists every downstream dependency, so the review runs on data instead of best guesses.
- Dependency mapping before a migration
Unseen interdependencies frequently trigger migration headaches—in fact, companies like Nutanix highlight mapping them out as a critical prerequisite before shifting anything. Graph modeling instantly reveals which applications are heavily intertwined, allowing your team to migrate them as a single unit and roll out transitions in an orderly, logical sequence.
- Application rationalization
Retire, replace or modernize? Age is only one input. You also want to know how much the business depends on it and what it’s plugged into, and the graph has both. Bonus: it’ll show you the three tools doing one job, handy for software asset management and the next license renewal.
- Incident root cause
When an outage hits, everyone scrambles just to figure out what broke. A relationship model takes you a step further, helping pinpoint the root cause and trace every impacted component. Instead of chasing dozens of disconnected alarms, mapped dependencies let you filter the noise and pull everything into a single, cohesive timeline.
- Governance and hidden systems
Unmanaged SaaS tools, forgotten cloud resources and undocumented APIs sit outside most inventories. Continuous discovery feeds them into the graph, which supports shadow IT discovery and shrinks the gap between what is documented and what is running.
Data-domain uses such as fraud detection and customer views are valid too, but they sit outside this guide.
How a knowledge graph helps enterprise AI
Say you want an AI assistant to suggest changes to your environment. It’ll need to know that environment, and an off-the-shelf model knows nothing about yours. Without enterprise context the model guesses. The guesses read as confident.
Retrieval-augmented generation (RAG) fixes part of this by fetching relevant text before the model answers. GraphRAG goes further. It retrieves connected facts from a graph, which helps with questions that span several steps. Gartner named it one of its top data and analytics trends for 2026, warning that “Most retrieval-augmented generation initiatives fail when high thresholds of accuracy are required.”
Early research points the same way. A study by BNP Paribas and partners found that graph-based retrieval can improve efficiency and reduce hallucinations on financial documents. The authors also note that results depend on the dataset, the graph design and the task.
The honest limit
Bolt a graph onto an LLM and hallucinations don’t just vanish. One late-2025 study caught models giving answers that flatly contradicted the graph sitting right in front of them, mostly because they tripped over relational hierarchies.
So, keep the graph accurate, keep it current, and test what the AI tells you against it. Feed an AI a stale graph and you get the same confident nonsense a stale spreadsheet would give you, just quicker.
How to build an enterprise knowledge graph: six steps
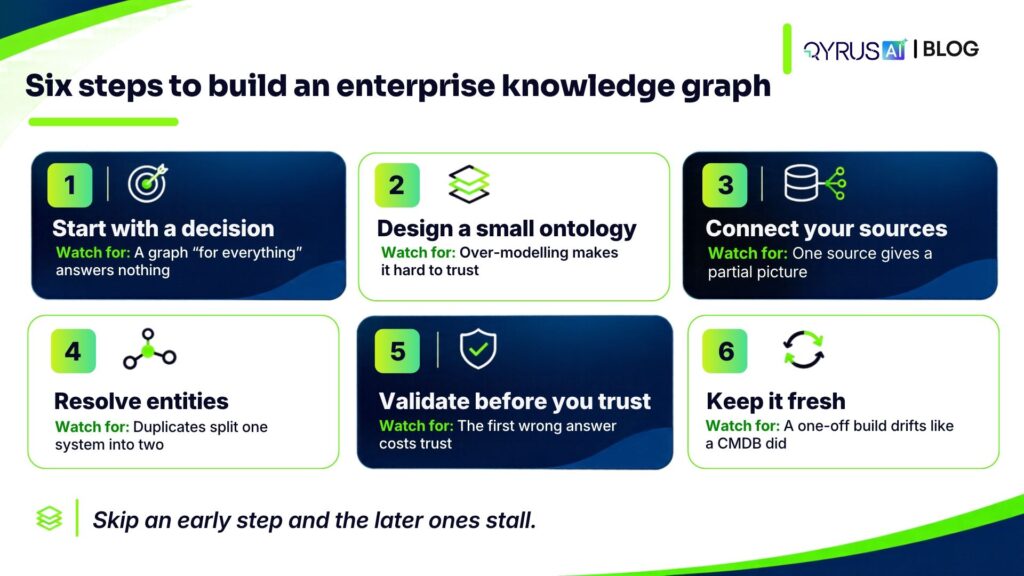
Projects that stall have usually skipped something early on. Do these in order. Each step lists its typical failure.
Step 1: Start with a decision, not a dataset
Pick one question the graph must answer, such as “Which applications can we safely retire?” What breaks: a graph built “for everything” answers nothing well.
Step 2: Design a small ontology
Pick a handful of entity types and how they relate, and stop there. Whether something is an entity or just a property is a call for the people who know the domain (engineers on their own will guess). What breaks: over-model it and the graph gets hard to fill, and harder still to trust.
Step 3: Connect your sources
Hook up the places the facts already live: discovery, monitoring, cloud accounts, the CMDB, the service desk. You don’t need all of them on day one, only the two or three that answer your Step 1 question. Tag every node and edge with where it came from. What breaks: one big import with no lineage, and the first time an answer is wrong, nobody can say which source to blame.
Step 4: Resolve entities, and keep resolving
Set merge rules for each entity type, and treat resolution as an ongoing capability. Neo4j notes that duplicate nodes dilute a graph’s power. What breaks: duplicates split one system into two and distort every answer.
Step 5: Validate before you trust
Before anybody bets a decision on it, run the graph past some rules and a human or two. Pick dependencies you already know about and see if the graph agrees. Atlan’s construction guide says the same thing. What breaks: one wrong answer in a live review, and the room stops trusting the graph.
Step 6: Keep it fresh, and measure it
Track how recently each node was confirmed, how many nodes have relationships, and which questions the graph answers well. What breaks: treating the build as a one-off project, so the graph drifts just as the CMDB did.
Knowledge graph, graph database, data catalog or CMDB: which do you need?
Honestly, these four get muddled all the time, and it’s not hard to see why. Atlan’s comparison draws the line simply: a catalog inventories assets so people can find them, while a knowledge graph models relationships for machine reasoning.
Here is a rule of thumb. If you only need a list of what you own, a catalog or CMDB may be enough. If your questions start with “what depends on” or “what is affected”, you need relationships, and a graph is the better fit.
These tools overlap, and teams often confuse them. Atlan’s comparison puts the split plainly: a catalog inventories assets so people can find them, while a knowledge graph models relationships for machine reasoning.
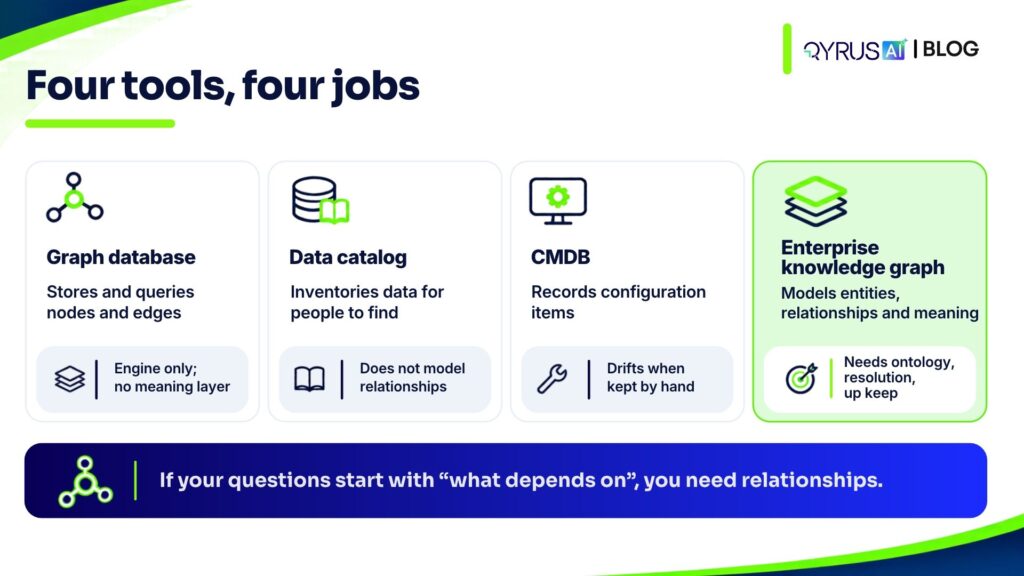
Tool | What it does | Best for | Watch out for |
Graph database | Stores and queries nodes and edges | Fast traversal of connected data | No meaning layer on its own |
Data catalog | Inventories data assets for people to find | Discovery and ownership | Does not model relationships for reasoning |
CMDB | Records configuration items | Audit and service management | Drifts when maintained by hand |
Enterprise knowledge graph | Models entities, relationships and meaning | Impact analysis, AI context, rationalization | Needs an ontology, entity resolution and upkeep |
Here is a rule of thumb. If you only need a list of what you own, a catalog or CMDB may be enough. If your questions start with “what depends on” or “what is affected”, you need relationships, and a graph is the better fit.
How QyrusAI helps
The QyrusAI Enterprise Knowledge Graph creates a connected, continuously updated model built around your IT environment. QyrusAI Auto Discovery continuously gathers information from that environment. The graph then maps relationships across applications, infrastructure, business processes and operational information.
Nobody has to babysit a fixed database by hand. When your infrastructure moves, the model moves too. You can pull in legacy data you already have, and if the scans miss something, your team can add it manually.
The graph also serves as a shared intelligence layer for other QyrusAI capabilities. It supports assessment, application rationalization, cloud migration planning and other modernization decisions. So when your team asks, “If we change this, what else could be affected?”, the answer comes from a model of your own estate.
Frequently asked questions
What is an enterprise knowledge graph in simple terms?
It is a connected map of the things in your organization and how they relate. In IT, that means applications, servers, services and business processes, linked by their dependencies. You can then ask questions that cross all of them.
How is a knowledge graph different from a graph database?
A graph database is the storage and query engine. A knowledge graph adds an ontology and rules that give the data meaning. You can build a knowledge graph on a graph database, but the database alone is not one.
Do I need a knowledge graph if I already have a CMDB?
Not always. A CMDB works well as a record of configuration items if you keep it accurate. If you need to trace dependencies, assess change impact or feed context to AI, a graph adds the relationships a CMDB often lacks.
How long does it take to build one?
It depends on how many sources you connect, how clean your data is, and how large your ontology grows. Starting with one decision and a few sources shortens the first release. Plan for ongoing upkeep, not a finish date.
Can a knowledge graph stop AI hallucinations?
It can reduce them by grounding answers in verified relationships, but it cannot remove them. Research shows models can still contradict the graph data they receive. Keep the graph accurate and check AI answers against it.
Conclusion
Your IT data is not failing for lack of volume. It fails for lack of connection. An enterprise knowledge graph turns separate records into a model you can reason over, so you can see impact before you change something, and give AI the context it needs.
Three points to keep: model relationships and not just components; build around one decision, with entity resolution and validation; and keep the graph fresh, because a stale graph misleads.
QyrusAI builds this model through continuous discovery. Request a demo to see how QyrusAI can map your IT environment’s dependencies.
 November 13, 2026
 13 min