







AIOps · Self-Healing Operations · BizOps · FinOps · L1/L2 Automation
Run Without Firefighting. Improve With Every Incident.
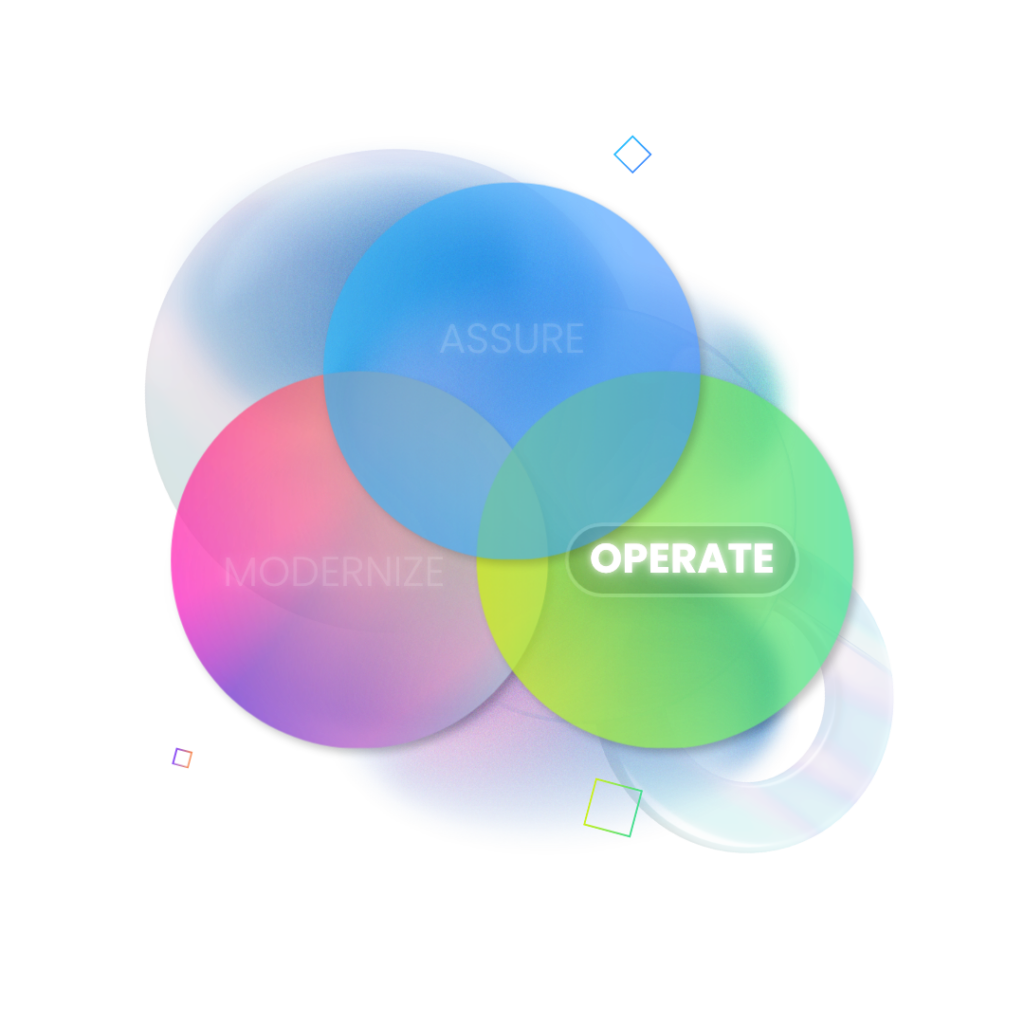
Most IT operations teams are caught in a loop: alert fires, war room convenes, repeat. The same incidents recur because the knowledge from resolving them never makes it back into the system. QyrusAI Application Run AI breaks that loop – by correlating signals across your entire estate, resolving the routine without a human, and turning every production incident into permanent operational knowledge that prevents the next one.
Challenge
The Operations Problem
Every IT Team Knows.
Lorem Ipsum Lorem IpsumLorem IpsumLorem IpsumLorem IpsumLorem IpsumLorem IpsumLorem IpsumLorem IpsumLorem Ipsum
Alert Noise Without Context
Thousands of alerts, dozens of tools, no single view of what actually matters. SRE teams spend more time triaging than fixing — and still miss the signals that matter.
Operational Knowledge Lives in People
Runbooks live in one engineer's head. When they go on leave — or leave the company — the knowledge goes with them. Attrition is an operational risk most teams have no plan for.
Repeat Incidents Recur Forever
Every post-mortem produces action items. Few of them reach the systems that generated the incident. Next month, the same war room convenes for the same issue.
Costs Are Attributed to Departments, Not Services
Cloud spend, application run costs, and license fees appear on an IT bill — but cannot be attributed to the specific business services or applications that generated them. Finance and IT are always negotiating from different data.
How it works
Operate — Bridge Sentence
Here is how Qyrus Application Run AI addresses each of these — by sitting above your existing monitoring stack, correlating signals across the whole estate, and building permanent operational knowledge with every incident.
Reduce thousands of alerts to a handful of actionable incidents.
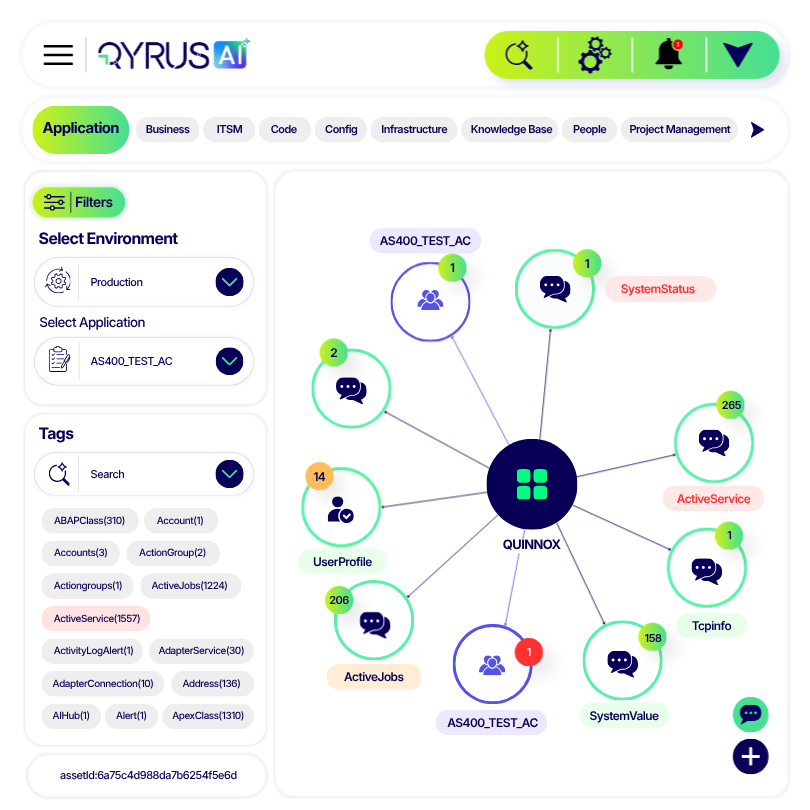
Qyrus AIOps ingests signals from your existing monitoring tools — Dynatrace, Datadog, New Relic, Splunk, ServiceNow — and correlates them across the full estate. Noise is eliminated. Incidents are grouped by root cause, not by alert volume. Every incident is annotated with the affected business service, the dependency path that caused it, and the operational cost of the disruption.
- Sits on top of your existing monitoring stack — no rip-and-replace required
- Correlates signals across infrastructure, application, and business service layers simultaneously
- Repeat incident detection: incidents flagged as a recurring pattern surface automatically — the war room question “have we seen this before?” is answered before it is asked
Resolve the routine without a human. Govern what reaches production.
L1/L2 automation handles the highest-volume, lowest-complexity ticket categories — restart sequences, threshold responses, known incident patterns — within policy bounds. Self-healing operations close failure patterns before they repeat. Human approval gates are enforced for Level 3 actions in regulated environments.
- L1/L2 automation on the ticket categories that consume the most on-call hours
- Self-healing operations: governed remediation that executes within the autonomy level you configure (Level 0–3)
- Every automated action is logged to Qhive with timestamp, policy reference, confidence score, and outcome
Every action is bounded, auditable, and reversible.
The Operate autonomy framework uses a Level 0–3 model: Level 0 recommends only; Level 1 prepares artifacts; Level 2 acts in controlled environments; Level 3 acts in production with explicit human sign-off. Regulated environments run at Level 2 or Level 3 by default. Every action — at every level — is logged to Qhive with the recommendation, confidence score, human decision, and outcome.
- Level 0–3 autonomy configuration per action class — never a binary “on/off” for AI in production
- Every action evidence-logged: what was recommended, what confidence, who approved, what happened
- DORA, FCA/PRA, and NIST AI RMF governance posture met by the platform architecture, not by a compliance overlay
Turn operational data into cost intelligence and modernization signals.
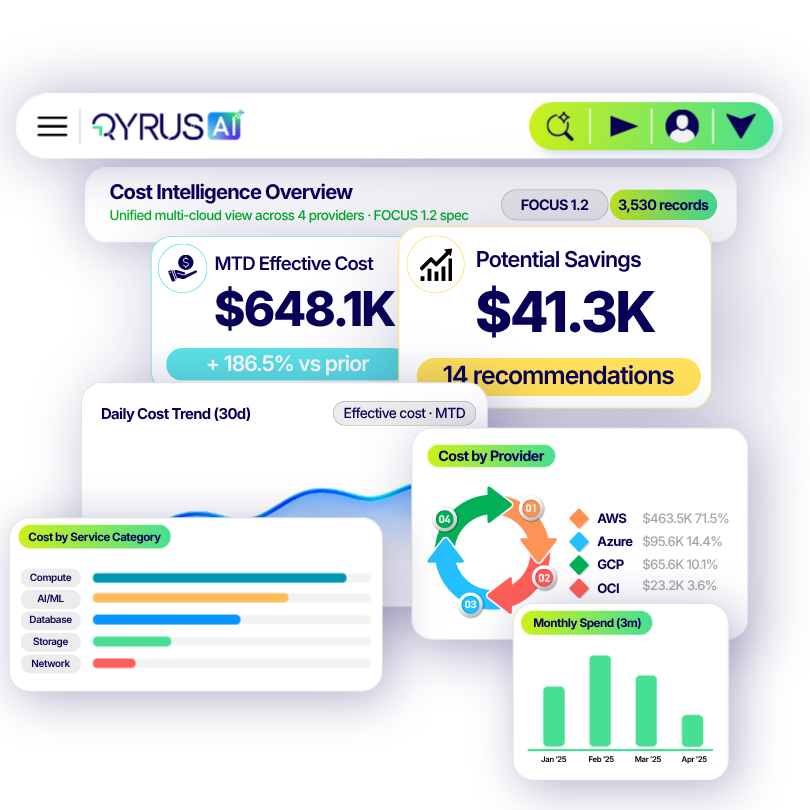
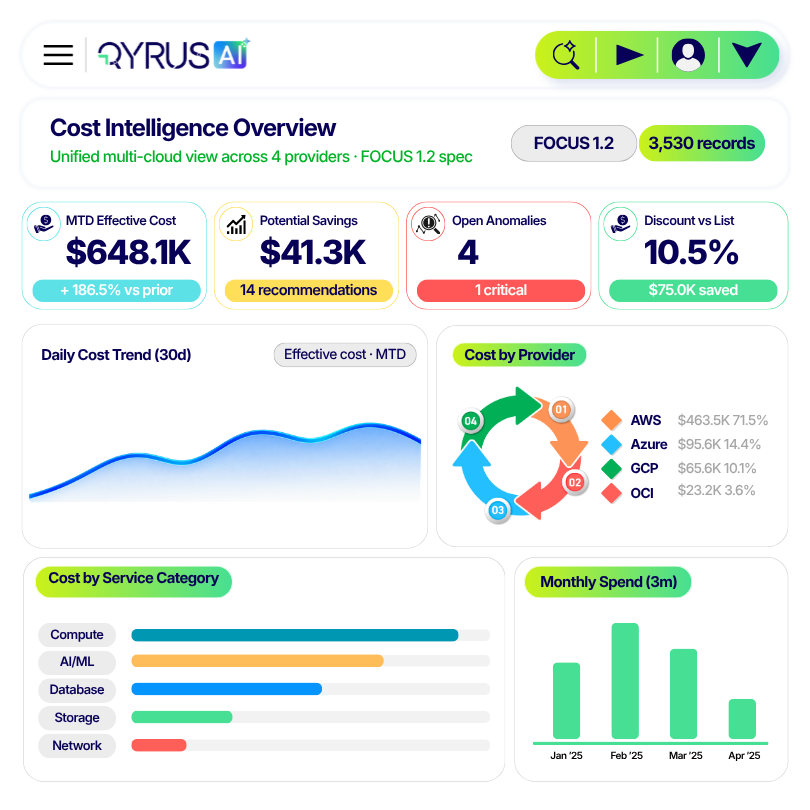
Every operational event, cost signal, and system health metric is stored in the Knowledge Graph and in Qhive. FinOps dashboards show cloud spend, license utilisation, and idle resource waste per application and per business service. BizOps dashboards link IT health to business service performance. Recurring incidents become the evidence base for a funded modernization programme.
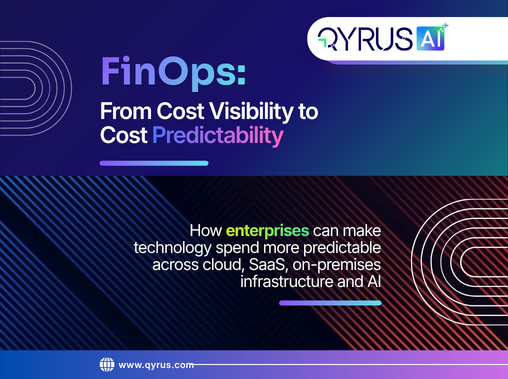
- FinOps: full cloud cost visibility attributed to applications and business services — not just cost centres
- BizOps: business service health in real time — the COO sees business impact, not IT metrics
- Operate → Modernize feedback: recurring incident patterns are scored as modernization priority signals in the Knowledge Graph
Core Features
Lorem Ipsum Dolor Sit Amet. Lorem Ipsum Dolor Sit Amet. Lorem Ipsum.
incididunt ut labore et dolore magna aliqua. Ut enim ad minim veniam, quis.
Built for Operations Teams
That Run Complex Enterprise Estates at Scale.
AIOps & Event Intelligence
Correlates signals across your full estate — application, infrastructure, and business service. Noise reduction from thousands of alerts to actionable incidents.
BizOps
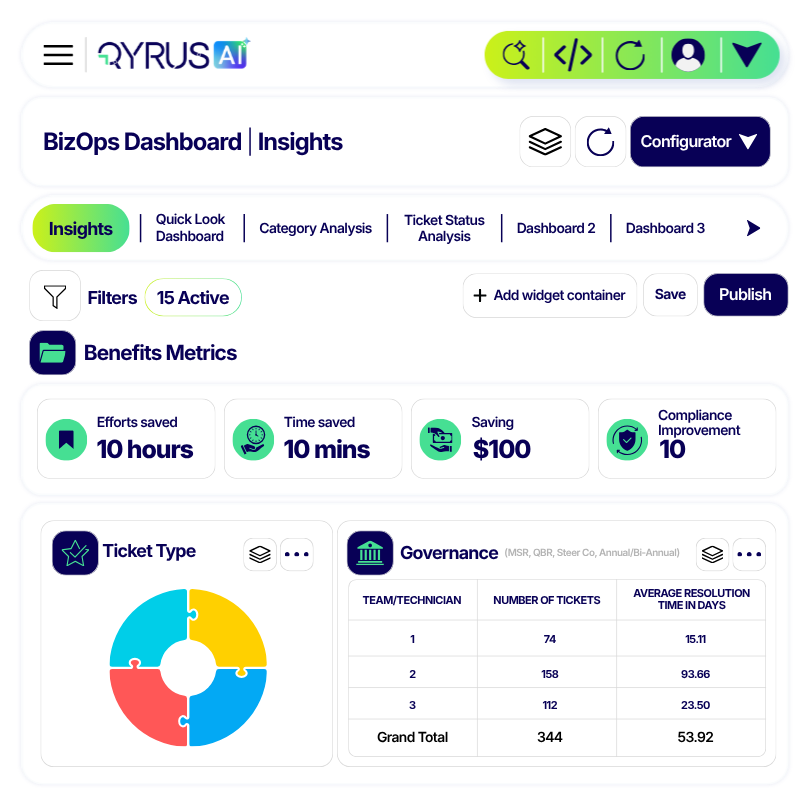
Business service health in real time — maps IT events to the business services and transactions they affect. What the COO sees, not just what the dashboard shows.
FinOps & Cloud Cost Intelligence
Full cloud and application spend visibility attributed to business services. Idle resource detection, license optimisation, and vendor overlap identification.
DevSecOps
Security embedded in the delivery pipeline — vulnerability detection, shift-left security testing, and continuous compliance monitoring without slowing release velocity.
Self-Healing Operations
Governed remediation for known failure patterns — resolves recurring incidents autonomously within configured policy bounds. Every action logged, reversible, and auditable.
L1/L2 Automation
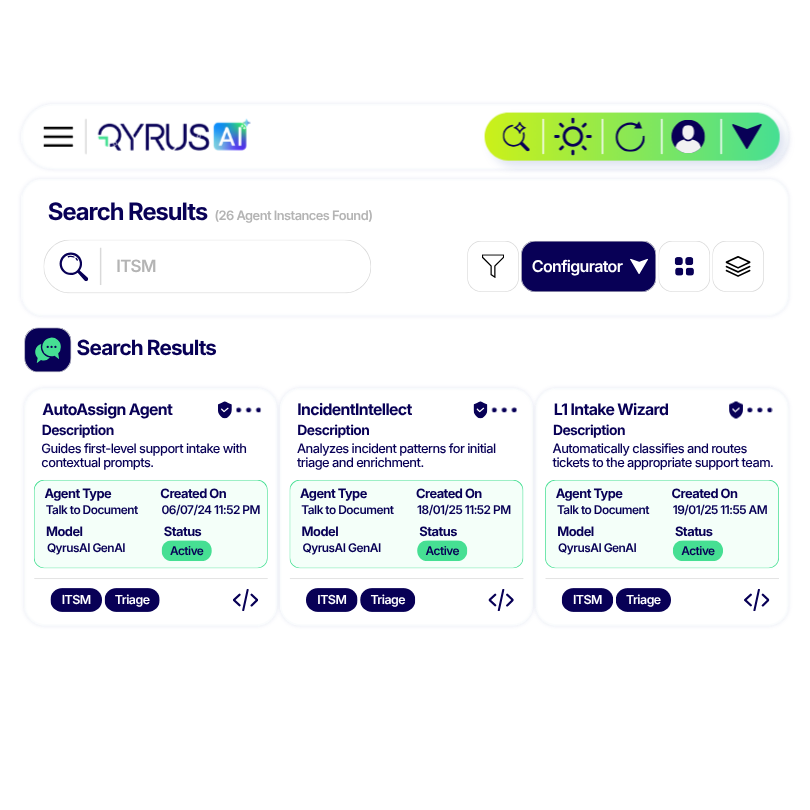
Agentic automation for the ticket categories that consume the most on-call hours — restart sequences, threshold responses, runbook execution — without human triage.
Intelligent Twin
A digital twin of your production estate — simulates the impact of any operational change before it runs. Change management risk reduced to a pre-approved blast-radius score
Shadow IT Discovery
Continuously discovers applications and SaaS tools procured outside IT governance — including AI tools. Closes the gap between the CMDB and reality.
Software Asset Management
Full software license inventory with utilisation analytics per application and per team. Renewal preparation from evidence, not from what the vendor tells you.
A GLIMPSE ON THE NUMBERS
Outcomes & Benefits
Fewer Incidents. Faster Resolution. Autonomous Operations. Evidence-Backed.
Faster incident resolution
Fewer reactive incidents
Run cost reduction
ROI — UK bank, full platform
Continuous testing. Continuous learning. Continuous value.
Join leading enterprises
driving the loop forward.
Integration
Sits on Top of Your Existing Monitoring Stack No Rip-and-Replace Required
QyrusAI reads from your existing observability tools and writes context back to them — so your current monitoring investment is enriched, not replaced. The intelligence layer runs above Dynatrace, Datadog, and ServiceNow; the stack you built does not change.
CUSTOMER TESTIMONIALS
Enterprises running the loop
in their own words.
Real Teams. Real Outcomes. Real Confidence in what ships next.
Lorem Ipsum Dolor Sit Amet. Lorem Ipsum Dolor Sit Amet. Lorem
Qyrus not only supports the testing of our Web, Mobile, and API components as part of our CI/CD processes, but also in ongoing regression-testing across our partner ecosystem. The real power of Qyrus is that we have this extremely broad testing capability in one tool, run in the cloud, and reusable across all our development teams.

The transition to Qyrus has marked a significant turning point for us. By embracing automation, we not only streamlined our SAP test automation process but also achieved a remarkable reduction in overall project testing time by 40%.
... the Qyrus platform have been a great addition to Monument's product delivery capabilities. Within a few months, we have been able to create a comprehensive test suite of complex end-to-end test scenarios spanning multiple platforms and channels. The Quinnox team has helped us embed the Qyrus solution, and the supporting processes around it, into our agile delivery methodology.
Resources
Explore our curated library of expert blog posts, in-depth whitepapers, and real-world case studies, designed to help you stay ahead in the world of AI-driven application lifecycle management.
August 19, 2026 |
18 min
User Acceptance Testing Best Practices: A Complete UAT Strategy Guide for SAP Teams
Read More
August 13, 2026 |
2 min
Qyrus Named in Gartner’s Market Overview for API and MCP Testing Tools
Read More
August 13, 2026 |
2 min
Qyrus Named in Gartner’s Market Overview for API and MCP Testing Tools
Read More
Blog
August 19, 2026 |
18 min
User Acceptance Testing Best Practices: A Complete UAT Strategy Guide for SAP Teams
Read More
Case Study
Events
Reports
August 13, 2026 |
2 min
Qyrus Named in Gartner’s Market Overview for API and MCP Testing Tools
Read More
Whitepaper
August 13, 2026 |
2 min
Qyrus Named in Gartner’s Market Overview for API and MCP Testing Tools
Read More
FREQUENTLY ASKED QUESTIONS
Common Questions About QyrusAI Modernization
Lorem ipsum dolor sit amet, consectetur adipiscing elit, sed do eiusmod tempor
incididunt ut labore et dolore magna aliqua. Ut enim ad minim veniam, quis nostrud.
How is this different from Dynatrace, Datadog, or our existing monitoring tools?
Dynatrace and Datadog produce excellent telemetry. QyrusAI Operate does two things they do not: (1) it takes automated action, not just detection — L1/L2 automation resolves the routine ticket without a human; (2) it correlates to business impact, not just infrastructure metrics — BizOps maps what the IT event means for a specific business service in financial terms. We sit above your existing monitoring stack, not instead of it. The conversation is never “replace Dynatrace” — it is “what happens after Dynatrace fires the alert?
Does it require agent installation on every system?
No. Operate reads from APIs, event streams, and connectors into your existing monitoring and ITSM tools. For some environments a lightweight collector is deployed for specific data sources, but this is scoped per engagement. You do not need to instrument every system before value is delivered.
How does the self-healing and L1/L2 automation work — and how is it governed in a regulated environment?
The autonomy framework uses a Level 0–3 model: Level 0 recommends and a human decides; Level 1 prepares the artifact; Level 2 acts in a controlled environment; Level 3 acts in production with explicit human approval required. Regulated environments — financial services, healthcare, public sector — are configured at Level 2 or Level 3 by default. Every automated action is logged to Qhive with timestamp, policy reference, confidence score, and outcome. The audit trail exists before a regulator asks for it.
What is the blast-radius mapping capability and how does it differ from a CMDB?
A CMDB records what someone entered. Blast-radius mapping in Operate is derived from what the system actually does — signals observed across the estate are used to infer which systems depend on each other and how much traffic flows between them. When a change is proposed, the blast radius is calculated from observed dependency data, not from a manually-maintained record. The gap between the CMDB and the observed reality is usually the first thing customers see when we run an estate assessment.
How does Operate connect to Modernize and Assure — is it a separate purchase?
Operate delivers standalone value — AIOps, L1/L2 automation, FinOps, and BizOps all work independently. But the joint value of the three pillars is significantly greater: recurring incidents from Operate become regression tests in Assure (closing the production feedback loop), and operational cost data from Operate feeds the Modernize prioritization engine (telling you which systems to transform first based on what they are actually costing you in production). The commercial model supports starting with one pillar and expanding — most customers start with Operate or Assure and add the others in sequence.
Does it support SAP environments?
Yes. Operate connects to SAP systems through the SAP connector. AIOps correlates SAP production events — IDoc failures, BAPI errors, transport import issues — to the affected business processes and surfaces them alongside non-SAP signals. Self-healing operations work in SAP environments where the failure pattern and remediation step are known and policy-approved. L1/L2 automation can handle SAP-specific runbook steps (transport import retry, IDoc reprocessing, job restart) within configured governance bounds.
• STAY AHEAD, STAY IN THE LOOP •
Turn Operational Knowledge Into Autonomous Action
Starting With One Incident Tower.
30-minute walkthrough — we will show you what noise reduction and L1/L2 automation look like on your highest-volume incident tower, with a cost-per-ticket trajectory.