Why Your Monitoring Tools Are Missing the Big Picture—And How BizOps Fixes It
 Varun RS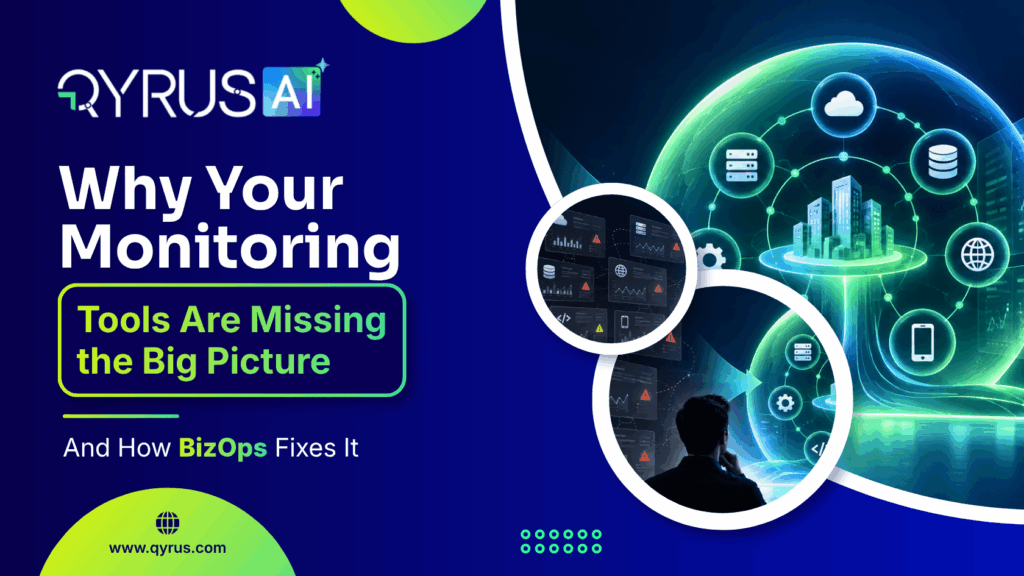
For years, IT operations has been built around a relatively simple premise: if systems are functioning as expected, the business will function as expected. That assumption shaped how teams monitored environments, prioritized incidents, and measured operational success. System uptime, response times, and infrastructure health became proxies for business performance. In simpler, more linear environments, that model largely held true.
The enterprise environment has changed. Modern businesses depend on interconnected applications, APIs, data pipelines, cloud services, and infrastructure layers that continuously interact. A single customer action such as placing an order, completing a transaction, or accessing a service may traverse multiple systems, each with its own dependencies and performance characteristics. The relationship between system health and business outcome is no longer direct. It is mediated by complexity.
When Complexity Breaks the Model
While system component reliability has generally improved across isolated hardware layers, rising enterprise dependency across multi-cloud and API ecosystems means cost-per-incident is steadily increasing even as event frequency levels off. Today, 1 in 5 organizations (20%) report that their most recent major IT outage cost over $1 million.
The Limits of System-Level Visibility
Teams may have comprehensive visibility into individual components such as servers, services, and applications, but that visibility does not automatically explain how those components collectively support business processes. Systems can appear healthy in isolation while the business experiences degradation in aggregate. Transactions slow down, customer journeys break, and workflows stall because something within the dependency chain is no longer functioning optimally.
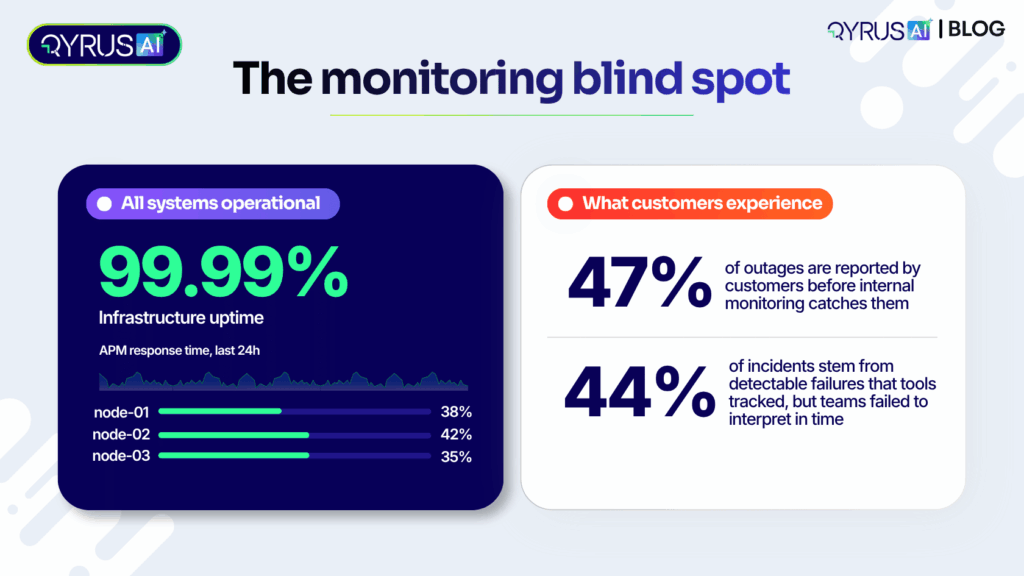
Highlighting this structural blind spot, 47% of outages are reported by customers before internal monitoring catches them—meaning nearly half of all major system disruptions are first flagged by end-users rather than internal technical alerts. Furthermore, 44% of incidents are caused by “detectable” failures, representing issues that technical telemetry actively tracked, but teams failed to interpret or prioritize correctly in time.
The Gap Between Signals and Meaning
The challenge is not necessarily a lack of data or visibility. Most organizations already have dashboards, alerts, monitoring, and observability tools. The challenge is context. These signals describe what is happening at a system level but often do not explain what it means at a business level. Teams are therefore forced to correlate signals manually, trace dependencies, and infer impact under time pressure and with incomplete information.
The Cost of Operating Without Context
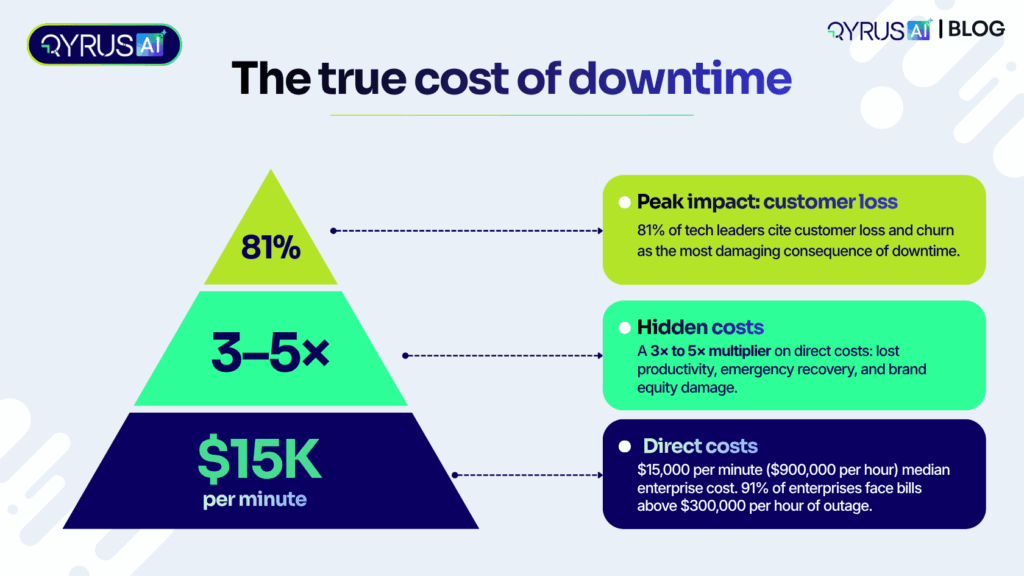
The gap between system visibility and business understanding has tangible and severe financial consequences. The median cost of enterprise IT downtime has jumped to approximately $15,000 per minute ($900,000 per hour), and 91% of enterprises report that a single hour of IT downtime costs them more than $300,000.
Beyond immediate direct losses, organizations face 3x to 5x hidden costs—including lost productivity, emergency recovery expenses, and brand equity damage. In fact, 81% of technology leaders cite customer loss and churn as the most damaging direct consequence of downtime.
Incident response can slow down because teams lack clarity about impact. Prioritization can become inconsistent because technical severity does not always correspond to business importance. Communication between IT and business stakeholders can also become fragmented because each group is working from a different view of the environment. Over time, this misalignment creates operational inefficiency and strategic risk.
A Shift in Perspective: Toward BizOps
Business Operations Intelligence, often discussed in the context of BizOps, brings business goals and IT operations into a shared operating context. The goal is not to discard monitoring or observability. It is to connect technical signals to the services, workflows, KPIs, and business outcomes they support. The unit of analysis moves from the individual component toward the service, workflow, transaction, and outcome.
This broader approach is also reflected in the evolution of business observability. Rather than looking only at technical telemetry, business observability connects operational data with business metrics and context so teams can understand how technology affects business performance.
From Components to Relationships
This requires relational visibility rather than isolated visibility. Teams need to understand how systems are connected, how dependencies are structured, and how changes or failures propagate across the environment. More importantly, those relationships need to be mapped to business services so that the impact of an issue can be understood in terms that matter beyond IT. An alert becomes more useful when it can indicate which service, workflow, or customer journey may be affected.
Why Static Approaches Fall Short
Traditional approaches such as CMDBs, manual service mapping, and periodic documentation exercises can struggle to keep pace with modern environments. Systems evolve, dependencies shift, and new services are introduced continuously. A static representation can therefore become outdated between documentation cycles. For organizations operating across hybrid, cloud, and legacy environments, maintaining an accurate picture of the estate requires continuous discovery and relationship mapping.
The Need for Continuous Intelligence
What is required is a continuously evolving model of the enterprise that reflects the current state of systems, their relationships, and their connection to business outcomes. This changes how teams perceive their environment, prioritize work, and make decisions under pressure. The emphasis shifts from collecting more signals to creating usable context from the signals already available.
Where QyrusAI Fits In
This is where QyrusAI brings a business-aware operations approach into the broader enterprise application lifecycle. As an agentic platform, QyrusAI is designed to help enterprises modernize, assure, and operate their enterprise applications through a connected lifecycle.
QyrusAI continuously discovers enterprise assets, maps dependencies, and connects technical relationships to business services. At the core of this approach is QyrusAI’s Live Enterprise Knowledge Graph, which provides a continuously observed model of applications, dependencies, and business services. This creates a shared context for understanding operational issues rather than relying solely on isolated alerts or static documentation.
This connected lifecycle is delivered across three key pillars:
- Modernize: Helps enterprises discover applications and dependencies, assess technical debt, rationalize portfolios, and plan and execute modernization with greater architectural context.
- Assure: Focuses on testing and validation across web, mobile, API, SAP, data, and test orchestration, helping teams validate application changes before they reach production.
- Operate: Brings operational intelligence across AIOps, observability, BizOps, FinOps, automation, and incident response, helping teams connect technical health with business impact. Its Operate capabilities extend this context directly into operations, including BizOps, where technical signals can be connected to the business services and transactions they affect.
Together, these pillars create a connected view across the application lifecycle, with a shared Knowledge Graph and operational context that can flow seamlessly between modernization, quality, and operations.
From Reaction to Clarity
When business context is connected to technical signals, incident response can become more precise because impact is easier to identify. Prioritization can be grounded in business relevance rather than technical severity alone. Decision-making can also become faster because teams can work from a shared, contextual understanding of the environment instead of piecing together fragmented information.
This approach aligns with the broader direction of enterprise observability. IBM notes that business observability connects technical signals with business metrics and context, helping teams understand how IT system health affects core business outcomes. The underlying principle is straightforward: visibility becomes more valuable when teams can connect what changed in technology to what matters to the business.
The Real Shift
The deeper shift is in how IT operations is measured. It is no longer sufficient to know that systems are running. Teams also need to understand whether the services and business processes those systems support are running as intended. That requires visibility into relationships, dependencies, service health, and business impact.
Frequently Asked Questions (FAQs)
- What is the main difference between traditional IT monitoring and Business Operations Intelligence (BizOps)?
Traditional IT monitoring focuses on isolated component metrics such as CPU loads, server uptime, and response latency. BizOps bridges the gap between IT and business goals by connecting those technical signals directly to the workflows, transactions, services, and business outcomes they support.
- How does QyrusAI eliminate manual dependency mapping?
QyrusAI utilizes its Live Enterprise Knowledge Graph to continuously discover enterprise assets, map real-time technical dependencies, and link them automatically to business services without relying on outdated static documentation or manual CMDB spreadsheets.
- Why do traditional CMDBs fail in modern hybrid environments?
Modern multi-cloud and microservice architectures evolve rapidly through continuous deployment pipelines and automated scaling. Traditional CMDBs and periodic documentation exercises quickly become obsolete, creating critical blind spots during active outages.
- How does QyrusAI help reduce alert fatigue for SRE and IT Operations teams?
By mapping technical anomalies within the Live Enterprise Knowledge Graph and correlating raw telemetry against actual business workflows, QyrusAI groups related alerts and prioritizes them based on true commercial impact rather than isolated technical thresholds.
Closing Thought
The question is no longer whether your systems are healthy.
It is whether you understand what that health actually means for your business.
Ready to move from system-level visibility to business-level understanding? Explore QyrusAI BizOps to see how technical signals, dependencies, services, and business impact can be connected in a single operational context.
 October 1, 2026
  7 min
7 min